
Fig. 2
- ID
- ZDB-FIG-151221-1
- Publication
- Barker et al., 2015 - Sensorimotor Decision Making in the Zebrafish Tectum
- Other Figures
- All Figure Page
- Back to All Figure Page
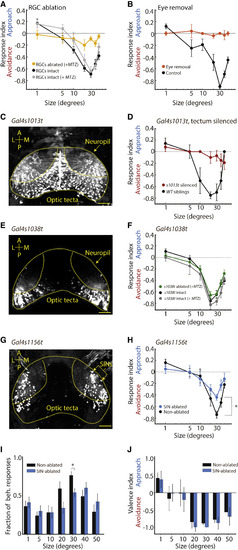
RGCs and Tectal Neurons Contribute to Size Discrimination (A) Size discrimination tuning curves of Atoh7:Gal4, UAS:Nfsb-mChry-ablated fish (n = 14; yellow) and control conditions (Atoh7:Gal4, UAS:Nfsb-mChry with no MTZ treatment, n = 20, black; Atoh7:Gal4, UAS:Dendra with MTZ treatment, n = 10, gray). When RGCs are ablated, values are not significantly different from zero (p > 0.07 for all sizes except 30° [p = 0.039] and 40° [p = 0.012]; one-sample t test; Bonferroni correction). (B) Tuning curves of enucleated and control siblings (enucleated, n = 7, orange; control, n = 10, black). Under enucleated conditions, values are not different from zero (p > 0.30 for all sizes; one-sample t test; Bonferroni correction). (C) Expression pattern of Gal4s1013t shown in a 5-dpf larvae-expressing UAS:EGFP. Gal4s1013t labels a large portion, but not all, of the tectal neurons. (D) Tuning curve in Gal4s1013t-silenced larvae. When compared to WT siblings, Gal4s1013t, UAS:TeTxLC-CFP larvae showed a marked reduction in R.I., with no responses significantly different from zero (experimental, n = 7, red; control, n = 4, black; p > 0.200 for all sizes; one-sample t test; Bonferroni correction). (E) Expression pattern of Gal4s1038t shown in a larva expressing UAS:Kaede. Expression is restricted to the posterior tectum. (F) Tuning curves of Gal4s1038t, UAS:Nfsb-mChry-ablated fish (n = 18; green) and control conditions (Gal4s1038t, UAS:Nfsb-mChry with no MTZ treatment, n = 26, black; Gal4s1038t, UAS:Kaede with MTZ treatment, n = 10, gray). No significant changes in the R.I. are observed in ablated larvae compared to controls (two-way ANOVA with Tukey’s correction). (G) Expression pattern of Gal4s1156t, UAS:Kaede, labeling a subset of the SINs (yellow arrows), as well as additional tectal neurons. (H) Tuning curves for SIN-ablated fish (n = 16; blue) and control larvae (n = 16; black). SIN-restricted ablations were performed in Gal4s1156t, UAS:Kaede using a two-photon laser. R.I. is significantly reduced at 30° (two-way ANOVA with Bonferroni correction; p at 20° = 0.068; p at 30° = 0.040). (I) SIN-ablated larvae show fewer behavioral responses (two-way ANOVA with Bonferroni correction; uncorrected p at 30° = 0.004; same larvae as in H). (J) SIN-ablated larvae have an unchanged V.I. (ablated, n = 25, gray; non-ablated, n = 16, black; two-way ANOVA; Bonferroni correction; same larvae as in H). The scale bars represent 50 µm; A, anterior; L, lateral; M, medial; P, posterior. Hatched yellow lines denote the optic tecta for each image. Neuropil is indicated in the right tectum with a yellow arrow. For all panels, error bars indicate the SEM. p < 0.05. See also Figure S3. |