FIGURE
            Fig. 1
- ID
- ZDB-FIG-151214-51
- Publication
- Takeuchi et al., 2015 - LSD1/KDM1A promotes hematopoietic commitment of hemangioblasts through downregulation of Etv2
- Other Figures
- All Figure Page
- Back to All Figure Page
                
                    
                        Fig. 1


| 
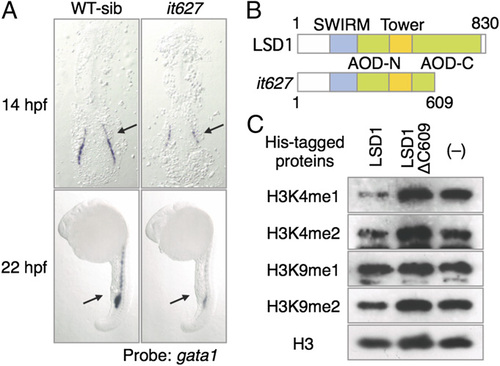
 Isolation of LSD1 mutant. (A) Expression of gata1 in WT sibling (WT-sib) and it627 embryos. The arrows indicate hematopoietic tissues: posterior LPM (14 hpf) and ICM (22 hpf). (B) Structures of the LSD1 proteins. SWIRM, Swi3p, Rsc8p, and Moira domain; Tower, tower domain. (C) Results of the demethylation assay using bacterially expressed LSD1 proteins and bulk histones from calf thymus as substrates. Methylated proteins were detected by immunoblotting using specific antibodies. | 
                
                    
                        Expression Data


    | Gene: | |
|---|---|
| Fish: | |
| Anatomical Terms: | |
| Stage Range: | 10-13 somites to 26+ somites | 
                
                    
                        Expression Detail


                        Antibody Labeling


                        Phenotype Data


    | Fish: | |
|---|---|
| Observed In: | |
| Stage Range: | 10-13 somites to 26+ somites | 
                
                    
                        Phenotype Detail


                        Acknowledgments


This image is the copyrighted work of the attributed author or publisher, and
ZFIN has permission only to display this image to its users.
Additional permissions should be obtained from the applicable author or publisher of the image.
      Full text @ Proc. Natl. Acad. Sci. USA


        