
Fig. 1
- ID
- ZDB-FIG-151208-1
- Publication
- Teh et al., 2015 - Modulating expression level of secreted Wnt3 influences cerebellum development in zebrafish transgenics
- Other Figures
- All Figure Page
- Back to All Figure Page
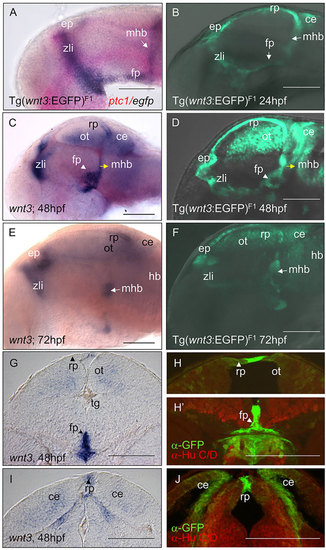
EGFP and Wnt3 expression in transgenics under control of the wnt3 promoter. A stable zebrafish transgenic line containing the 4kb wnt3 promoter drives EGFP expression in a wnt3-like manner with spatio-temporal correlation with endogenous transcripts. (A) egfp transcript expression (purple) in 4kb wnt3 promoter transgenic line Tg(-4.0wnt3:EGFP)F1 colocalized with ptc1 (pink) at the zona limitans intrathalamica (zli) at 24hpf. (B) An in vivo image of 24hpf Tg(-4.0wnt3:EGFP)F1 showing EGFP+ domains highlighted by the transgenic line. (C,E) wnt3 transcripts (purple) are detected in the cerebellum (ce), epithalamus (ep), floor plate (fp), optic tectum (ot), roof plate (rp), midbrain hindbrain boundary (mhb) and hindbrain (hb) of larvae at 48hpf (C) and 72hpf (E). (D,F) In vivo images of Tg(-4.0wnt3:EGFP)F1 at 48hpf (D) and 72hpf (F) showing similar EGFP+ domains. (G-J) Comparison of midbrain (G,H) and cerebellum (I,J) cross sections of wnt3 expression in a 48hpf zebrafish brain (G,I) with corresponding cross sections of Tg(-4.0wnt3:EGFP)F1 (H-J) that detected EGFP expression in similar regions. wnt3-positive domains include the optic tectum, floor plate and cerebellum. Co-immunohistochemical detection of EGFP and Hu-positive neurons showed that EGFP+ domains in the floor plate, floor plate and cerebellum are flanked by neurons (H,H′,J). Scale bars: 100µm. |