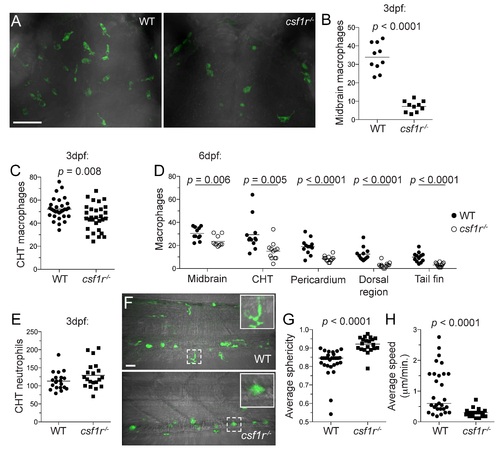
(Related to Figure 1). Larval csf1r mutant zebrafish have impaired macrophage development. Enumeration of larval macrophages in wild-type (WT) and csf1r-/- mpeg1:YFP fish. (A) Maximum intensity projections of the hindbrains of WT and csf1r-/- mpeg1:YFP larvae at 3dpf. Scale bars, 100µm. Number of macrophages in the (B) midbrain and (C) CHT of 3dpf fish. (D) Absolute numbers of macrophages at 6dpf. Number of neutrophils in the CHT of 3dpf fish as determined by Sudan Black staining. (B - E) Each symbol represents individual larvae. (B - D) Data are representative of at least two experiments. (F - H) Assessment of macrophage motility: (F) Representative maximum intensity projections of the CHT of WT and csf1r-/- mpeg1:YFP larvae at 6dpf and (G) average sphericity and (H) speed of individual macrophage tracks. Hashed boxed indicate zoomed region displayed on right corner. Scale bar, 40µm. Horizontal lines indicate means (B - E) or median values (G, H). Statistical significance determined by two-tailed unpaired Student’s t test (B - E) or Mann-Whitney U test (G, H).
|
