
Fig. S5
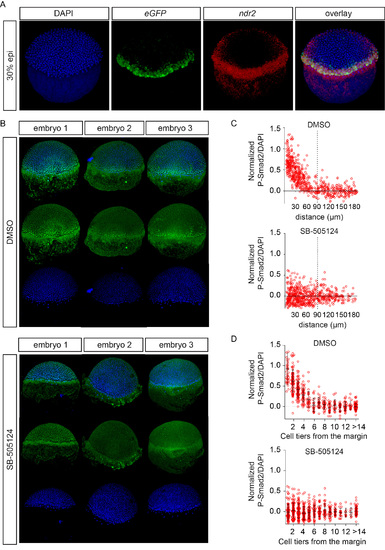
Extent of Nodal signaling in the margin (A) Double fluorescent WISH for eGFP and ndr2 in 30% epiboly (epi) embryos. (B) Z-projections of whole mount immunofluorescence for P-Smad2 in 50% epiboly embryos either treated with DMSO or SB-505124, which were used for quantification of Nodal signaling in the margin shown in (C) and (D). DAPI was used as a counter-stain. Note that embryo 3 in both cases are those shown in Figure 1A stained with P-Erk, which was performed as a double whole mount immunofluorescence with the P-Smad2. (C) Quantification of P-Smad2 staining intensity in DMSO- and SB-505124-treated embryos depicted in (B). Intensities are expressed as P-Smad2/DAPI ratios as a function of distance to the border of the margin. Distance is plotted on the x-axis and the dotted line indicates 90 µm, which corresponds to around six cell tiers. (D) As in (C) but with data binned in 15 µm bins. The black horizontal line represents the average intensity for each bin ± SD. |
Reprinted from Developmental Cell, 35, van Boxtel, A.L., Chesebro, J.E., Heliot, C., Ramel, M.C., Stone, R.K., Hill, C.S., A Temporal Window for Signal Activation Dictates the Dimensions of a Nodal Signaling Domain, 175-185, Copyright (2015) with permission from Elsevier. Full text @ Dev. Cell