
Fig. 2
- ID
- ZDB-FIG-151113-19
- Publication
- Heier et al., 2015 - Ploidy manipulation and induction of alternate cleavage patterns through inhibition of centrosome duplication in the early zebrafish embryo
- Other Figures
- All Figure Page
- Back to All Figure Page
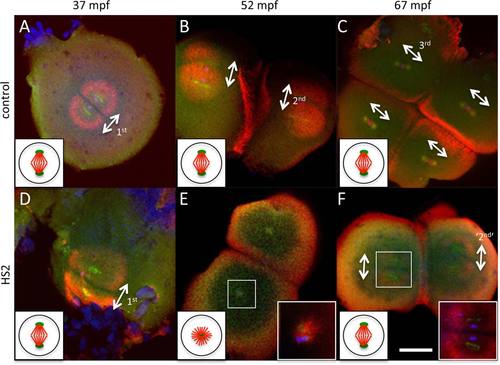
HS2 causes defects in bipolar spindle formation during the second cell cycle, likely caused by centrosomal duplication defects during the first cycle. Immunofluorescence microscopy of whole mount blastodiscs, labeled to detect α-tubulin (red), γ-tubulin (green), and DNA (blue, only readily apparent in high magnification inserts in E,F) in control (A–C) and HS2-treated (D–F) embryos. Bipolar spindle is normal during the first cell division cycle (A,D). During the second cell division cycle, each of the two previously generated blastomeres show monoasters in HS2-treated embryos (E, insert) instead of bipolar spindles in control embryos (B). One cycle later, HS2-treated embryos resume the formation of bipolar spindles and cell cleavage (F, insert), although the number of blastomeres is halved compared with control embryos (forming four blastomeres in HS2-treated embryos [F] and eight in control embryos [C]). Centrosomal material can be observed near the center of astral structures in both bipolar spindles and monoasters. In all cells, this centrosomal material appears duplicated with centers at each of the spindle poles, except in HS2-treated embryos during the second cell cycle, where centrosomal material appears as a single mass at the center of a monoaster (E, insert). The absence of a pair of centrosomes during the second cell cycle in HS2-treated embryos is presumably caused by defects in centriolar duplication during the first cell cycle, the time of heat treatment. The bipolar spindle is a dynamic structure that appears first, during metaphase, as a tight array of midzone microtubules (as in C) and later, during anaphase, as a diastral structure (A,B,D,F). Where present, white double-arrows indicate axes of bipolar spindles for the corresponding cell cycle (1st, 2nd, or 3rd, with ‘2nd’ indicating the bipolar spindle that forms after the one-cell cycle lag). Scale bar = 100 µm in F (applies in A–F). Inserts in (E,F) are amplified 9 × and 4.5×, respectively. Diagrams on the bottom left of each panel illustrate an idealized spindle during metaphase (microtubules in red, centrosome in green) within a blastomere at each stage. Spindles exhibit a normal bipolar structure in all panels except in the embryo undergoing a cell division stall in E, in which a microtubule-based monoaster emanates from a single centrosome. In the micrographs, the bipolar spindle exhibits somewhat different appearances due to its rapid reorganization during the cell cycle (Theusch et al., 2006; Yabe et al., 2007; Wühr et al., 2010): compact spindle midzone with weakly labeling asters during metaphase (as in C), solid asters during early anaphase (as in B, E, F), wider, hollow asters during late anaphase (as in A, D). Microtubule enrichments observed between parallel spindles in B, C, and F, or between monoasters in E, correspond to the furrow microtubule array for the previous cell cycle, which is derived from astral microtubules and forms during cytokinesis. |