
Fig. 10
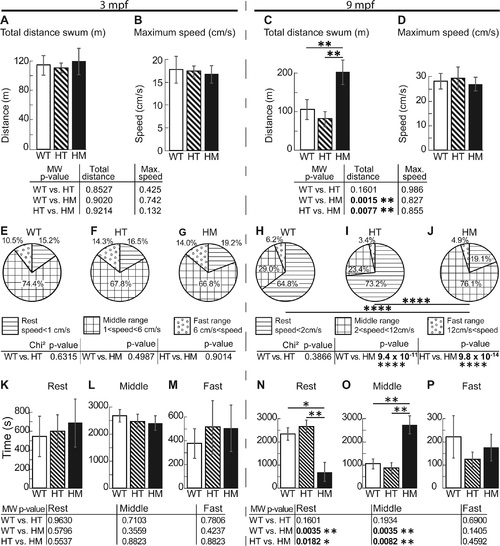
The 9 mpf col6a1ama605003 HM fish swam around twice the distance of WT and HT fish. We video-recorded free-swimming WT, HT and HM col6a1ama605003 fish at 3 mpf and 9 mpf for one hour in the horizontal plane, then we calculated by triangulation the total distance swum (A, C) and the maximum instantaneous speed (B, D). (A) At 3 mpf, there was no significant difference in the total distance swam between WT and HT, between WT and HM or between HT and HM. (C) At 9 mpf, there was a significant difference in the total swum distance between WT and HM (C, p-value 0.0015) and between HT and HM (C, p-value 0.0077), but not between WT and HT, indicating the late development of impairment in HM. There was no difference in the maximum speed between genotypes at the two ages studied (B, D). (E-J) We represented in pie-charts the speed activity profile (SAP) distributions in percentage of 3 classes and according to the fish bl. i.e. rest SAP (horizontal lines, speed slower than 1 cm/s for 3 mpf, E, and 2 cm/s for 9 mpf, H), middle range SAP (squares, speed comprise between 1 to 6 cm/s for 3 mpf, F and 2 to 12 cm/s for 9 mpf, I) and fast SAP (open dots, speed superior to 6 cm/s for 3 mpf, G and to 12 cm/s for 9 mpf, J). This representation allowed us to show that at 9 mpf, there is a highly significant difference between WT versus HM (H vs. J, p-value 9.421x10⁻¹¹) and between HT and HM (I vs. J, 9.83x10⁻¹⁴). We further analyzed in a pairwise manner the histograms of the time (s) fish swum in the 3 SAP classes (speed distribution) described above for 3 mpf (K, L and M for rest, middle and fast SAP respectively) and 9 mpf (N, O and P for rest, middle and fast SAP respectively). This analysis showed that there was no difference in SAP within any of the 3 mpf groups. But the analysis showed that 9 mpf HM swam significantly more time in middle range SAP at the expense of their resting time i.e. in the rest SAP the difference is significant between WT and HM (N, p-value 0.0035); between HT and HM (N, p-value 0.0182). In the middle range SAP, the difference was significant between WT and HM (O, p-value 0.0035) and between HT and HM (O, p-value 0.0082). For 3 mpf fish, n = 12, 16 and 11 for WT, HT and HM respectively; for 9 mpf fish, n = 15, 19 and 7 for WT, HT and HM respectively. For each histogram and pie-chart, we performed either a Mann-Whitney (MW) or Chi-square test respectively, with *, ** and **** indicating p-values of <0.05, 0.01 and 0.0001 respectively. |
| Fish: | |
|---|---|
| Observed In: | |
| Stage: | Adult |