|
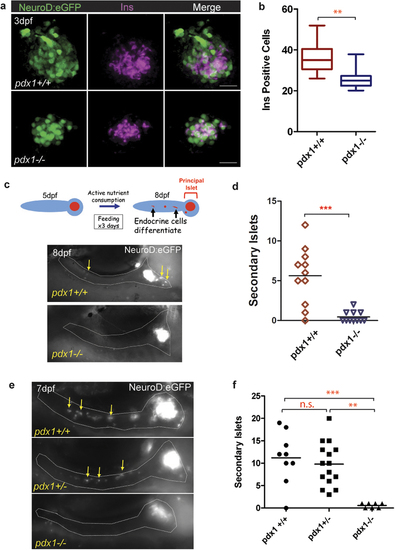
Islet formation but impaired expansion in pdx1 mutants. (a) Immunostaining for insulin (Ins, magenta) and GFP protein (green) in wild type and mutant NeuroD:eGFP+ embryos at 3 dpf. Maximum intensity projection (MIP) of confocal stacks. Scale bar, 20µm. (b) Number of Ins-expressing cells from embryos as shown in (a). (wt, n = 9; mu, n = 10) **p < 0.001 (t-test). The line indicates the median, boxes span the 25th to 75th percentile, whiskers the 10th to 90th percentile. (dpf, days post fertilization) (c, top) Schematic of experiment to evaluate feeding induction of secondary islets. Embryos were provided with nutrient powder (SDS100) from day 5 until day 7, and imaged live on day 8 to detect secondary islet cells. (c, bottom) NeuroD:eGFP+ endocrine cells are detected outside of the islet in control pdx1+/+ larvae (left), which are absent in pdx1-/- mutants (right). The pancreas is outlined (gray) based on a simultaneously acquired brightfield image. (d) Quantitation of secondary islets formed in wild type (n = 11) and mutant (n = 11) larvae treated as in (c), ***p < 0.0001, t-test. (e) Representative 7 dpf NeuroD:eGFP+ larvae treated with Ly411575 starting on day 4 and examined live by fluorescence microscopy. Heterozygous and control larvae, but not mutants, show robust induction of new GFP+ endocrine cells in the pancreatic tail (arrows). (f) Quantitation of second wave islet cells from NeuroD:eGFP+ larvae treated as in (e). ***p < 0.0001; **p < 0.001; n.s., not significant (one-way ANOVA, Tukey Multiple Comparison test). n(pdx1+/+) = 8, n(pdx1+/-) = 13, n(pdx1-/-) = 7. In (c) and (e), the fluorescent signal in the prinicipal islet has been overexposed to reveal single cells and clusters in the surrounding pancreas. Single cells and clusters were quantitated as secondary islets.
|