
Fig. 2
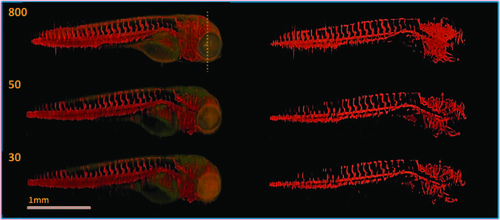
TraNac Tg(KDR:mCherry) zebrafish embryo images reconstructed from the densely sampled (800 projections) and down-sampled data sets of 50 and 30 projections. (Left) Images reconstructed from the fluorescence [red] and transmission projection images [green] and (right) corresponding segmentation images. The number of projections used to reconstruct each image is indicated in the corresponding subfigure (left). Note that the loss of resolution at the zebrafish tail is attributed to the live embryo moving its tail outside the depth of field of the imaging system during the experiment. Scale bar pertains to all images. |