
FIGURE
Fig. S4
Fig. S4
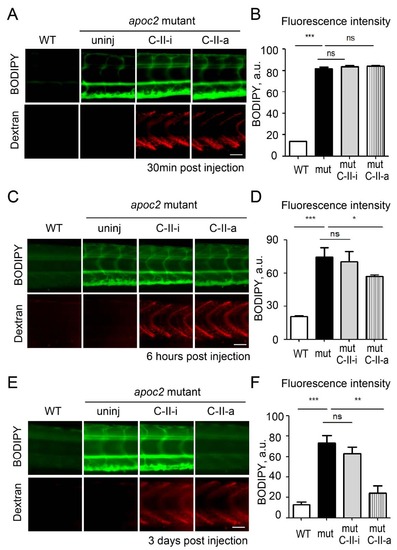
Injection of human apoC-II mimetic peptide: Time course The C-II-a and C-II-i peptides were injected as in Fig. 6. (A and B) 30 minutes after injection; (C and D) 6 hours after injection; (E and F) three days after injection. Larvae were stained with BODIPY. Red dextran fluorescence indicates successful injection. Scale bar, 50 µm. (B, D and F) Quantification of BODIPY staining results. Mean±SEM; n=3; ***, p<0.001; **, p<0.01; *, p<0.05; ns, not significant. |
Expression Data
Expression Detail
Antibody Labeling
Phenotype Data
Phenotype Detail
Acknowledgments
This image is the copyrighted work of the attributed author or publisher, and
ZFIN has permission only to display this image to its users.
Additional permissions should be obtained from the applicable author or publisher of the image.
Full text @ Dis. Model. Mech.