
Fig. 1
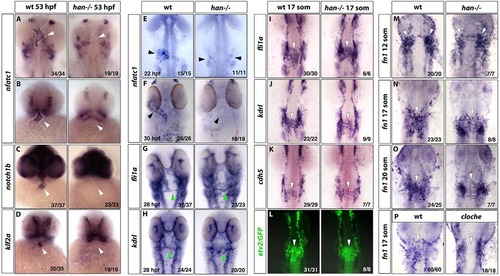
Endocardium fails to differentiate in hand2 mutants. (A-D) In situ hybridization staining for nfatc1 (A, flat-mount embryos; B, ventral view of whole-mount embryos), notch1b (C) and klf2a (D) in wild-type siblings (left column) and hand2 mutants (right column) at 53hpf shows the loss of differentiated endocardial markers in hand2 mutants. White arrowheads denote the endocardium, which is also outlined by a white dotted line (A,B). Expression of these endocardial markers becomes enriched at the atrio-ventricular (AVC) boundary at this stage, although some expression throughout the endocardium is still apparent. (E,F) Endocardial nfatc1 expression (arrowheads) is greatly reduced and split bilaterally (E) or absent (F) in hand2 mutants at 22hpf (E) and 30hpf (F), as analyzed by in situ hybridization. (G,H) Expression of vascular endothelial/endocardial markers fli1a (G) and kdrl (H) at 28hpf. The endocardial precursors form an endocardial sheet at the midline region but fail to coalesce into a cardiac cone. A subset of these progenitors contributes to the first aortic arch, which appears to form normally in hand2 mutants (green arrowheads). (I-L) Expression of fli1a, kdrl, cdh5 and etv2:GFP in the midline population of vascular endothelial/endocardial precursor cells (arrowheads) is largely unaffected in hand2 mutants at the 17-somite stage. (M-O) Fibronectin (fn1) expression analysis in hand2 mutants. fn1 expression shows no difference in premigratory endocardial precursors (white arrowheads) between wild type (left column) and hand2 mutant (right column) embryos at the 12-somite stage (M). At the 17-somite (N) and 20-somite (O) stages, hand2 mutants have fewer fn1-expressing endocardial cells at the midline compared with wild-type embryos, while many bilaterally located cells are observed. (P) cloche mutants do not show fn1 expression at the midline at the 17-somite stage, which suggests that the midline population of fn1-expressing cells corresponds to the endothelial/endocardial progenitors. All panels were flatmounted ventral side upwards, except for the ventral views in whole-mounted embryos in B-D. The number of embryos with the representative expression pattern out of the total number of embryos analyzed is shown in the lower right-hand corner. |