
FIGURE
Fig. S2
- ID
- ZDB-FIG-150831-16
- Publication
- Nath et al., 2015 - PTPMT1 Inhibition Lowers Glucose through Succinate Dehydrogenase Phosphorylation
- Other Figures
- All Figure Page
- Back to All Figure Page
Fig. S2
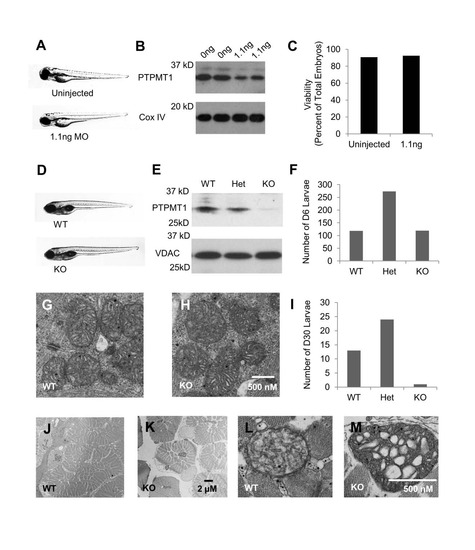
Morpholino Oligonucleotide Knockdown of ptpmt1 and Generation of ptpmt1 Knockout Zebrafish. Related to Figure 2. |
Expression Data
Expression Detail
Antibody Labeling
Phenotype Data
| Fish: | |
|---|---|
| Observed In: | |
| Stage Range: | Days 14-20 to Days 30-44 |
Phenotype Detail
Acknowledgments
This image is the copyrighted work of the attributed author or publisher, and
ZFIN has permission only to display this image to its users.
Additional permissions should be obtained from the applicable author or publisher of the image.
Full text @ Cell Rep.