
Fig. 6
- ID
- ZDB-FIG-150717-3
- Publication
- Mundell et al., 2015 - Vesicular stomatitis virus enables gene transfer and transsynaptic tracing in a wide range of organisms
- Other Figures
- All Figure Page
- Back to All Figure Page
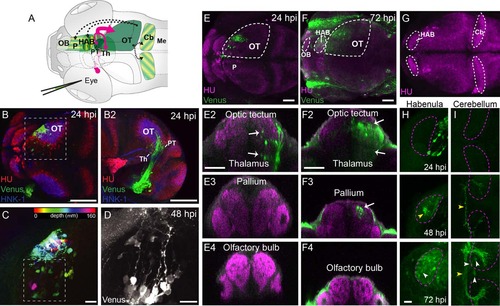
Transsynaptic labeling of the visual pathway in larval zebrafish infected with rVSV(VSV-G). (A) Diagram of unilateral eye injection. RGC axons (red arrows) project contralaterally to the optic tectum, pretectum, and thalamus. The locations of rVSV(RABV-G)-infected cells are indicated by green shaded areas. Putative axonal projections from the OT to the pallium, habenula, and cerebellum are labeled as dashed arrows. (B–D) rVSV(VSV-G) infection of the OT. Dorsal (B) and lateral (B2) views of a 24 hpi zebrafish stained for Venus (green), HuC/D (red, pan-neuronal marker), and HNK1 (blue, neuropil). Labeled RGC termini and tectal cell bodies can be seen in the right (contralateral) tectum. Boxed area in B is shown at higher magnification in C. Spectrum of colors represents depth from the dorsal surface of the tectum (red-yellow) to the ventral surface (blue-pink) for Venus-labeled cells. (D) High magnification of contralateral Venus-labeled tectal cells at 48 hpi, in location similar to C (boxed area). The majority of the labeled tectal neurons had a single process extending medially, consistent with the previously described morphology of retinorecipient neurons (Robles et al., 2011). (E,F) Dorsal views of confocal maximal projections show rVSV(VSV-G) labeling at 24 hpi (E) and 72 hpi (F). Areas delineated by dashed lines are the OT, habenula, and olfactory bulb. Transverse optical sections from each stage are shown in panels below (E2–E4 for 24 hpi and F2–F4 for 72 hpi). (G–I) Dorsal view of the zebrafish brain (3 dpf), stained with HuC (G). Areas delineated by dashed lines are the habenula and cerebellum, which are shown at higher magnification in H and I, respectively. 24 hpi labeling was restricted to the optic tectum, pretectum, and thalamus. At 72 hpi, labeling broadened and included cells in the pallium (F3), habenula (H), and the cerebellum (I). Labeled cells are indicated by white arrows or arrowheads and axons are labeled with yellow arrowheads). Venus-expressing cells were not present in the olfactory bulb (E4, F4). CB: cerebellum, HAB = habenula, Me = medulla, OB = olfactory bulb, OT = optic tectum, P = pallium, PT = pretectum, Th = thalamus. Scale bars = 100 µm in B–B2; 20 µm in C,D; 50 µm E–F4; 20 µm in H,I. |