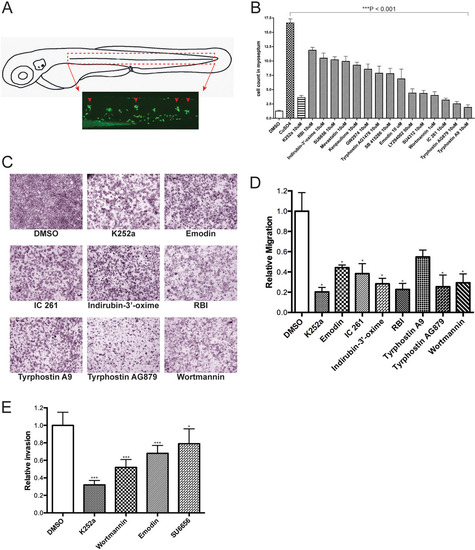
Confirmation of active compounds. (A) Schematic view of a 3day post-fertilization (dpf) larva. The boxed area corresponds to the horizontal myoseptum (dotted red lines) and shows the area where leukocytes were counted in all quantification experiments. (B) Quantification of infiltrating leukocytes in the lateral line after treatments with diverse inhibitors. The assays were carried out by manually counting leukocytes recruited to the lateral line neuromasts after Cu2+ treatment (10µM) as described in Results. In this experiment, drugs were added 30min prior to Cu2+ treatment. The graph shows average leukocyte numbers in the lateral line in negative controls (DMSO), in Cu2+ (as CuSO4) and in Cu2+-plus drug-treated fish. Leukocyte quantification shows significant reduction (***P<0.001) in neutrophil recruitment to damaged PLL neuromasts in larvae exposed to the compounds tested compared with Cu2+-exposed larvae, suggesting an inhibition of the neutrophil migration. Experiments were carried out with 15 larvae per condition. (C) Effects of kinase inhibitor compounds from LOPAC1280 on in vitro melanoma cell migration/invasion. 501-mel human melanoma cells were treated with DMSO (negative control) or the c-Met inhibitor K252a (positive control), and with the drugs indicated for 16h and then assayed for motility as described in Materials and Methods. Representative data from independent experiments are shown. Only compounds that had a negative effect on migration are shown. (D) Quantification of 501-mel cell migration assays. The migratory cells were counted and the results expressed as the mean number of migratory cells from two independent experiments. Measurements were calculated relative to control (DMSO). (E) Comparative effects of tested drugs on the cell invasion capacity of melanoma cells. 501-mel cells were treated with DMSO, K252a, Wortmannin, Emodin and SU6656 and then plated on Matrigel inserts in presence of HGF at 50ng/ml for 24h. The invasive cells were counted and the results expressed as the mean number of migratory cells in five random microscopic fields. Measurements were calculated relative to control (DMSO). Data collected were from two independent experiments. ***P<0.001; *0.01<P<0.05.
|
