
Fig. 4
- ID
- ZDB-FIG-150602-4
- Publication
- Hirose et al., 2014 - Mechanistic target of rapamycin complex 1 signaling regulates cell proliferation, cell survival, and differentiation in regenerating zebrafish fins
- Other Figures
- All Figure Page
- Back to All Figure Page
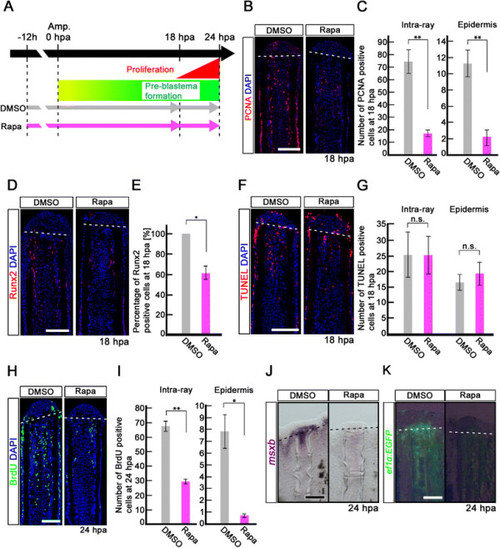
Rapamycin treatment inhibits proliferation of intra-ray and epidermal cells, but not apoptosis before blastema formation. (A) Scheme of rapamycin treatment before blastema formation. (B, C) PCNA-stained fin sections and quantification of PCNA-positive cells in the intra-ray and epidermis at 18 hpa. The number of PCNA-positive cells was significantly reduced by rapamycin treatment in both the intra-ray and epidermis at 18 hpa. **p < 0.01 by Student’s t-test. Error bars represent the standard error of 5 independent experiments. Scale bars: 100 µm. (D,E) Runx2-stained fin sections and quantification of Runx2-positive cells in the intra-ray. Rapamycin treatment significantly reduced the percentage of Runx2-positive cells at 18 hpa. *p < 0.05 by Student’s t-test. Error bars represent the standard error of 3 independent experiments. Scale bars: 100 µm. (F, G) TUNEL-stained fin sections and quantification of TUNEL-positive intra-ray and epidermal cells. Cell death was not increased in both the intra-ray and epidermis at 18 hpa. Error bars represent the standard error of 6 independent experiments. Scale bars: 100 µm. (H, I) BrdU-stained fin sections and quantification of BrdU-positive cells in the intra-ray and epidermis. Rapamycin treatment significantly reduced the number of BrdU-positive cells in the intra-ray and epidermis at 24 hpa. *p < 0.05 , **p < 0.01 by Student’s t-test. Error bars represent the standard error of 3 independent experiments. Scale bars: 100 µm. DAPI fluorescent signal (blue) indicates the presence of nuclei (B, D, F, H). Dashed white lines indicate the amputation planes (B, D, F, H). (J) Expression of msxb was examined by in situ hybridization at 24 hpa (n = 3). The msxb expression was barely detectable in rapamycin-treated fin regenerates. Scale bars: 200 µm. (K) EGFP fluorescence of Tg(ef1-α;EGFP) fin regenerates at 24 hpa (n = 3). The EGFP fluorescence was lost in rapamycin-treated fin regenerates. Scale bars: 200 µm. Dashed lines indicate the amputation plane (J, K). |