
Fig. 6
- ID
- ZDB-FIG-150506-33
- Publication
- Sasore et al., 2014 - Deciphering Combinations of PI3K/AKT/mTOR Pathway Drugs Augmenting Anti-Angiogenic Efficacy In Vivo
- Other Figures
- All Figure Page
- Back to All Figure Page
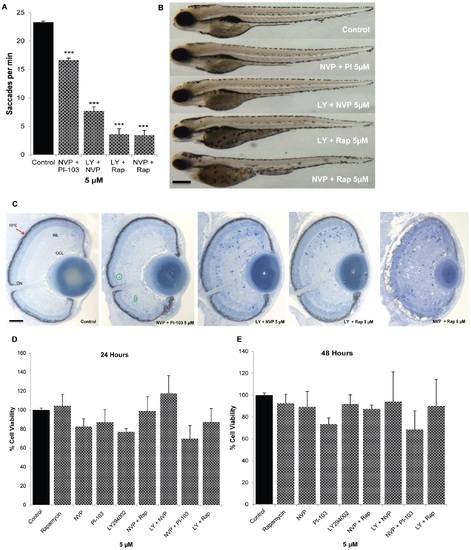
Safety pharmacology of PI3K/Akt/mTOR drug combinations in the zebrafish eye and human ARPE19 cells. 2 dpf larvae were treated with the most potent PI3K/Akt/mTOR inhibitors or control (0.1% DMSO) and eye saccades per minute quantified at 5 dpf (A). All PI3K/Akt/mTOR inhibitors reduce the number of saccades per minute compared to control but 5 µM NVP-BEZ235 + PI-103 larvae have a largely intact OKR. Representative images of the gross morphology of treated larvae (B). The most potent drug combinations exhibited little to no effect on overall morphology except for 5 µM NVP-BEZ235 + PI-103 which resulted in reduced eye size. Representative light microscopy images of treated larval eyes (C). Histological analysis was conducted on 1 µm sections of PI3K/Akt/mTOR-treated larvae at 5 dpf with ten sections analyzed per treatment. Retinal morphology appeared as normal in 5 µM NVP-BEZ235 + PI-103 treated larvae, except for a small number of dying cells. Increased number of apoptotic cells was observed in 5 µM LY294002 + NVP-BEZ235 or 5 µM LY294002 + Rapamycin treated larvae. In particular, 5 µM NVP-BEZ235 + Rapamycin (5 µM) exert adverse effects on retinal lamination, RPE, lens and optic nerve integrity. Effects of PI3K/Akt/mTOR inhibitors on viability of human RPE cells (ARPE19) (D-E). Confluent cells were treated with either 0.1% DMSO or PI3K/Akt/mTOR inhibitors individually or in combination (5 µM) for 24 h (D) and 48 h (E) and cell viability was measured by MTT assays. No significant difference was observed in ARPE19-treated cells compared to control. Results are expressed as percentage of control. PI3K/Akt/mTOR inhibitors showed no cytotoxicity on ARPE19 cells. GCL: ganglion cell layer, ONL: outer nuclear layer, INL: inner nuclear layer, ON: optic nerve, RPE: retinal pigment epithelium. Red arrows point to the RPE. Scale bars: B = 50 µm, C = 100 µm. Data are means ± s.e.m. (n = 3). N = 20-25 (A), N = 20 (B). |
| Fish: | |
|---|---|
| Conditions: | |
| Observed In: | |
| Stage: | Day 5 |