
Fig. S4
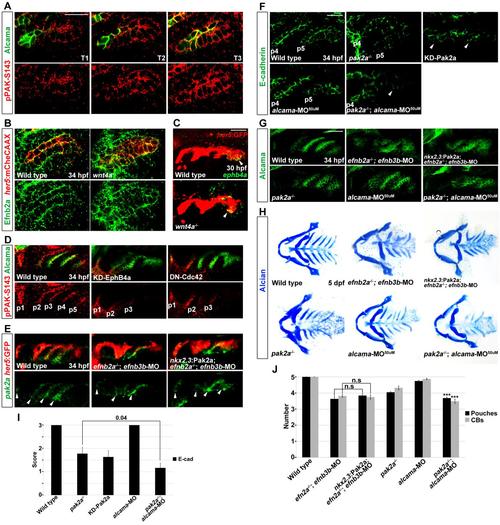
Parallel requirements for Pak2a and Alcama in pouch and CB cartilage development. (A) Double immunohistochemistry of pPAK-S143 (red) with Alcama (green) during maturation of the fifth pouch in wild types. As pouch development proceeds, Alcama becomes progressively enriched at sites of cell-cell contact while pPAK-S143 staining increases. Scale bar: 20 µm. (B) Immunohistochemistry shows that Efnb2a protein (green) is still present in her5:mCherryCAAX+ pouches (red cell membranes) in wnt4a-/- mutants and wild-type siblings. Efnb2a protein is also unaffected in surrounding neural-crest-derived cells (not labeled red) of wnt4a-/- mutants. (C) Fluorescent in situ hybridization shows ephb4a expression (green, arrowheads) in nascent her5:GFP+ pouches (labeled red by anti-GFP immunohistochemistry) in wnt4a mutants and wild-type siblings. Scale bar: 40 µm. (D) Double immunohistochemistry shows that pPAK-S143 staining (red) is reduced in the posterior pouches labeled by Alcama (green) of embryos expressing kinase-dead Ephb4a (nkx2.3:Gal4VP16; UAS:KD-Ephb4a) or dominantnegative Cdc42 (nkx2.3:Gal4VP16; UAS:DN-Cdc42) specifically in the endoderm. (E) Fluorescent in situ hybridization shows pak2a expression (green, arrowheads) in the her5:GFP+ pouches (labeled red by anti-GFP immunohistochemistry) in wild types, efnb2a-/-; efnb3b-MO embryos and nkx2.3:Pak2a; efnb2a-/-; efnb3b-MO embryos. (F) Immunohistochemistry shows E-cadherin protein (green) within pouches p4 and p5. In pak2a mutants or embryos expressing dominant-negative Pak2a specifically in the endoderm (nkx2.3:Gal4VP16; UAS:KD-Pak2a), E-cadherin staining is mildly reduced. Whereas injection of a low dose of alcama-MO (50 µM) into wild types causes no defects in E-cadherin localization, injection into pak2a mutants causes a greater reduction of Ecadherin staining (arrowhead) than seen in pak2a mutants alone. Scale bar: 20 µm. (G) Alcama immunohistochemistry reveals more severe defects in pouches in pak2a-/-; alcama-MO (50 µM) compound animals than in single pak2a mutants or alcama-MO animals. In addition, the nkx2.3:Pak2a transgene fails to rescue the pouch defects of efnb2a-/-; efnb3b-MO animals. Scale bar: 40 µm. (H) Alcian Blue staining reveals more severe losses of CB cartilages in pak2a-/-; alcama-MO (50 µM) compound animals compared with single pak2a mutants or alcama-MO animals. In addition, the nkx2.3:Pak2a transgene fails to rescue the CB cartilage defects of efnb2a-/-; efnb3b-MO animals. (I) Quantification of E-cadherin staining reduction. Data represent mean±s.e.m. P-values are shown. (J) Quantification of pouch and CB defects. Data represent mean±s.e.m. *** shows P<0.001 compared with pak2a mutants or alcama-MO animals. n.s., not significant. |