
Fig. 4
- ID
- ZDB-FIG-150420-23
- Publication
- Kobitski et al., 2015 - An ensemble-averaged, cell density-based digital model of zebrafish embryo development derived from light-sheet microscopy data with single-cell resolution
- Other Figures
- All Figure Page
- Back to All Figure Page
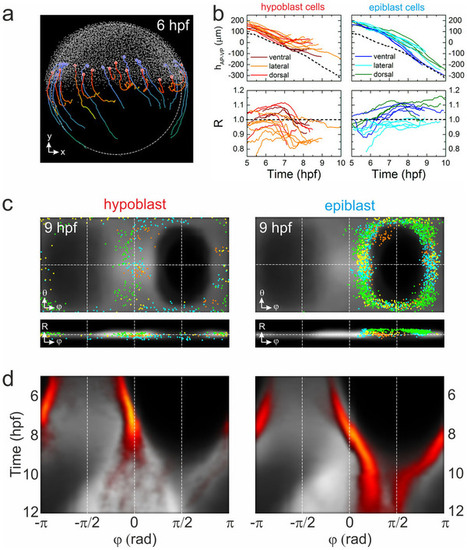
Visualization of blastoderm margin development. (a) Lateral view of a zebrafish embryo at 6hpf; cells are shown as small gray dots. The colored spheres denote examples of hypoblast (red) and epiblast (blue) cells; also shown are their trajectories from 6–10hpf. (b) Typical trajectories of selected hypoblast (left) and epiblast (right) cells during gastrulation; represented by their positions projected onto the AP-VP axis (top) and their radial positions (bottom). Trajectories are color-coded according to dorsal, lateral or ventral position; the dashed line (upper graphs) represents the position of the blastoderm margin. (c) Gall-Peters projections and radial plots of cell positions, showing an overlay of hypoblast (left) and epiblast (right) cells from different samples (shown in different colors) on top of the averaged model cell density (gray) at 9hpf. (d) Hypoblast (left) and epiblast (right) azimuthal cell density kymographs (yellow/red) overlayed onto the digital model kymograph from Fig. 3e (gray). |