
Fig. S3
- ID
- ZDB-FIG-150331-14
- Publication
- Barton et al., 2015 - A Cytosolic Juxtamembrane Interface Modulates Plexin A3 Oligomerization and Signal Transduction
- Other Figures
- All Figure Page
- Back to All Figure Page
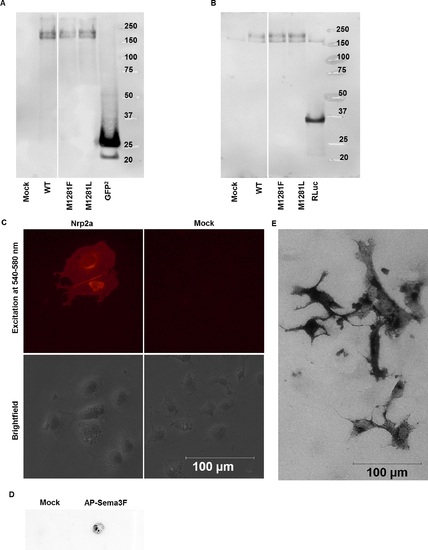
(A) Anti-GFP (1:1000 dilution, Clontech) western blot confirming expression of PlxnA3-GFP2 in the BRET2 assay. The expected molecular weights are 176 kDa and 27 kDa for PlxnA3-GFP2 and GFP2, respectively. (B) Anti-RLuc (1:2500 dilution, Millipore) western blot confirming expression of PlxnA3-RLuc in the BRET2 assay. The expected molecular weights are 185 kDa and 36 kDa for PlxnA3-RLuc and RLuc, respectively. (C) Anti-FLAG staining of COS-7 cells expressing FLAG-tagged Nrp2a. No fluorescence was observed in mock-transfected cells. The scale bar in the bottom left frame is the same for all images. (D) Dot blot confirming alkaline phosphatase activity in media from cells transfected with alkaline phosphatase-tagged SEMA3F. (E) Confirmation of alkaline-phosphatase-tagged SEMA3F binding to COS-7 cells expressing Nrp2a and PlxnA3. |