
Fig. 3
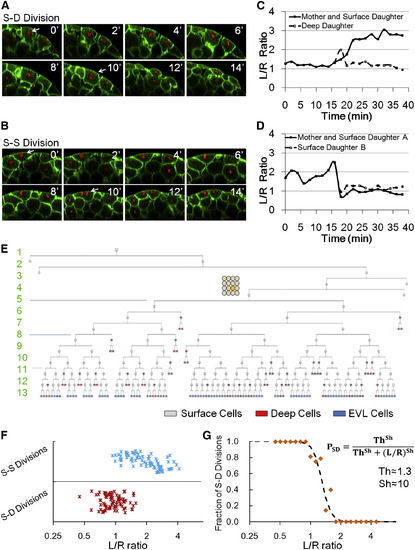
Division Patterns Determine NS, and Cell Shape Is Predictive of Division Orientation (A and B) Time courses of example S-D (A) and S-S (B) divisions. Arrows indicate the tracked cells. (C and D) Example S-D (C) and S-S (D) mother and daughter L/R dynamics throughout the cell cycle. (E) Full lineage up to 13th cell division of a middle blastomere at 16 cell stage (highlighted yellow cycle). For simplicity, deep cell branches are not drawn as the subsequent divisions always make more deep cells. Numbers indicate cell cycle number. (F) Relationship between cell shape and division choice. Each marker represents a tracked cell. n = 162. See also Figures S3A and S3B. (G) Fraction of S-D division calculated by binning data in (F) according to L/R values. A Hill function switch is used to fit data points. |
Reprinted from Cell, 159, Xiong, F., Ma, W., Hiscock, T.W., Mosaliganti, K.R., Tentner, A.R., Brakke, K.A., Rannou, N., Gelas, A., Souhait, L., Swinburne, I.A., Obholzer, N.D., Megason, S.G., Interplay of Cell Shape and Division Orientation Promotes Robust Morphogenesis of Developing Epithelia, 415-427, Copyright (2014) with permission from Elsevier. Full text @ Cell