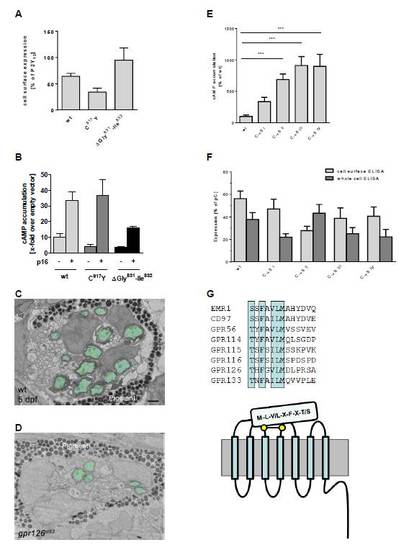
Rescue of st63 mutant zebrafish ortholog through p16 and influence of N-terminal positions on GPR126 activity levels, Related to Figure 4 (A) COS-7 cells were transiently transfected with wt, C917Y (gpr126st63) and ΔGly831-Ile832 (gpr126stl215) mutant zebrafish Gpr126 constructs and tested for cell surface expression and (B) basal and stimulated accumulation of cAMP. For the cell surface ELISA, the non-specific OD value (pcDps) was 0.003 ± 0.001 (set 0%) and the OD value of P2Y12 was 1.22 ± 0.33 (set 100%). Data are given as means ± SEM of at least two independent experiments each performed in triplicates. For cAMP assays, empty vector cAMP levels were 1.78 ± 1.12 nM/well. Data are given as means ± SEM of at least two independent experiments performed in triplicates. (C-D) Transmission electron micrographs (TEM) of 5-day post-fertilization (dpf) larvae showing crosssection through the PLLn. To control for developmental variability along the anterior-posterior axis, all nerves were analyzed at approximately the same body segment (between segments 5-7). (C) Myelinated axons are pseudocolored in green in a representative wt larva. (D) Myelinated axons are pseudocolored in green in a representative gpr126st63/st63 mutant larva. For (C-D), melanocytes laden with melanin granules are denoted by “pigment”. Scale bar = 1 µm. (E) To alter GPS structure, disulfide bridge-forming cysteines were systematically mutated to serine in GPR126 (C775S/ mutant C→S I, C794S/ mutant C→S II, C807S/ mutant C→S III and C809S/ mutant C→S IV). Interestingly, all mutants displayed constitutive activity in cAMP assay. In all cases, Cys mutations led to a reduction of cell surface expression levels indicating increased intrinsic activity of the mutants. COS-7 cells were transfected with wt and mutant GPR126 constructs. Basal cAMP levels were determined as described under Experimental Procedures. Specific cAMP levels (cAMP value of double HA/FLAG-tagged aGPCR constructs minus cAMP value of mock-transfected cells) were referred to the given wt receptor. Empty vector served as negative control (pcDps; cAMP level: 3.68 ± 2.54 nM/well). For GPR126, basal cAMP levels determined as x-fold over empty vector were 3.70 ± 1.20 (each set 100%). Data are given as means ± SEM of three independent experiments performed in triplicates. Statistics were performed by applying a one-way ANOVA in combination with Bonferoni as post-hoc test: *p<0.05; **p<0.01; ***p<0.001 (F) For expression studies, cell surface and whole cell ELISA were used to measure cell surface and total cellular expression levels, respectively. Specific optical density (OD) readings (OD value of double HA/FLAG-tagged aGPCR constructs minus OD value of mock-transfected cells) are given as percentage of the human P2Y12 receptor, which served as positive control (pC). For the cell surface ELISA, the non-specific OD value (pcDps) was 0.03 ± 0.03 (set 0%) and the OD value of P2Y12 was 1.30 ± 0.24 (set 100%). OD readings of 0.08 ± 0.04 (set 0%) and 2.22 ± 0.73 (set 100%) were found in sandwich ELISA (total expression) for the negative control vector (pcDps) and positive control (P2Y12). Data are given as means ± SEM of three independent experiments each performed in triplicates. (G) Studies with peptides derived from the first 11-19 amino acid positions downstream the GPS of GPR126 and GPR133 (Figs. 2 and 3) revealed positions in the N terminal half of the Stachel sequence that are relevant for its functionality. Many of those positions are highly conserved among aGPCRs. Based on current data, one can speculate that N-terminal cleavage at the GPS, extracellular ligand binding and/or ECD-mediated mechanic signals structurally enable the Stachel sequence to function as a peptide agonist for the 7TM.
|
