
FIGURE
Fig. 3 S1
Fig. 3 S1
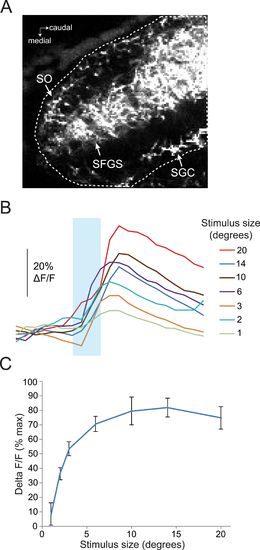
Response of RGC axons in the tectum to stimuli of varying sizes. (A) Baseline fluorescence of RGC axons in the anterior half of the tectum, 50 µM below the dorsal surface of the tectum. Dotted line shows ROI, which includes the SO, SFGS, and SGC. (B) Traces showing responses to a range of different size stimuli in RGC axons in the anterior tectum of one larva. Ath5:Gal4, UAS:GCaMP6s larvae were used for these experiments. (C) Average response of five larvae to stimuli 1–20° in diameter. |
Expression Data
Expression Detail
Antibody Labeling
Phenotype Data
Phenotype Detail
Acknowledgments
This image is the copyrighted work of the attributed author or publisher, and
ZFIN has permission only to display this image to its users.
Additional permissions should be obtained from the applicable author or publisher of the image.
Full text @ Elife