
Fig. 9
- ID
- ZDB-FIG-150319-30
- Publication
- Thomas et al., 2014 - High-Throughput Genome Editing and Phenotyping Facilitated by High Resolution Melting Curve Analysis
- Other Figures
- All Figure Page
- Back to All Figure Page
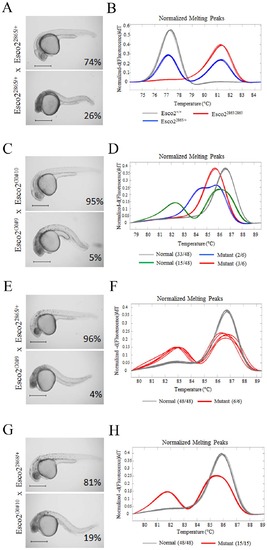
HRM established genotype-phenotype correlation within Esco2 mutant embryos from a G0 intercross. A) wild-type and mutant phenotypes with Mendelian frequencies in embryos derived from heterozygous intercross of the Esco2 retroviral insertion mutant hi2865. Note the head necrosis in the mutant embryos. B) HRM genotyping of wild-type (grey and blue curves) and mutant (red curves) embryos display perfect genotype-phenotype correlation. C) wild-type and mutant phenotypes in embryos derived from intercross of G0 Esco2 CRISPR injected fish. Note the head necrosis in mutant embryos. D) Select HRM curves of 6 mutant and 6 wild-type embryos that were subsequently sequences to reveal specific alleles result in specific curves. All Wild-type animals (beyond the 6 displayed here) make up the green and grey curves; while 5 of 6 mutant animals make up the unique red and blue curves establishing a genotype phenotype correlation. E&G) are wild-type and mutant phenotypes and frequencies of G0#9 (E) or G0#10 (G) crossed to Esco2 hi2865 heterozygous animals. F&H) are HRM curves of mutant and wild-type embryos (from E&G) that are Esco2 hi2865 heterozygous. All heterozygous curves (red) are mutants, and all grey curves are normal phenotypically. |
| Fish: | |
|---|---|
| Observed In: | |
| Stage: | Prim-5 |