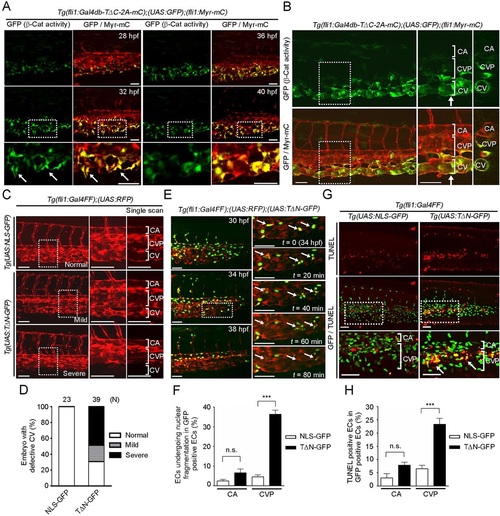
β-catenin-dependent gene expression is required for CV formation. (A) Confocal fluorescence images of a Tg(fli1:Gal4db-TΔC-2A-mC);(UAS:GFP);(fli1:Myr-mC) embryo at 28hpf and subsequent time-lapse images at the indicated time points. (Left) GFP images (β-catenin activity); (right) merge (GFP/Myr-mC) of GFP (green) and mCherry (red). The boxed areas are enlarged beneath. Arrows indicate β-catenin-dependent transcriptionally active ECs that sprout from the CV primordia. (B) Confocal images of the embryo at 48hpf, as in Fig. 1B. The boxed areas are enlarged in the center; transverse sections at the arrows are shown to the right. (C) Confocal stack RFP fluorescence images of 48hpf Tg(UAS:NLS-GFP) and Tg(UAS:TΔN-GFP) embryos with the Tg(fli1:Gal4FF);(UAS:RFP) background. The boxed areas are enlarged (center) and single scanned (right). Note that expression of dominant-negative Tcf, TΔN-GFP, in ECs caused a variety of impairments in CV formation. Embryos with the mild phenotype exhibited no blood circulation in the CV (middle row), whereas those with the severe phenotype lacked the CV (bottom row). Gal4FF, Gal4 DNA-binding domain fused to a duplicated portion of the VP16 transcriptional activation domain; NLS-GFP, nuclear localization signal-tagged GFP. (D) Quantification of the CV phenotypes observed in C, showing the percentage of normal embryos and those with mild and severe phenotypes. The number of embryos analyzed is indicated at the top. (E) Time-lapse confocal imaging of a Tg(fli1:Gal4FF);(UAS:RFP);(UAS:TΔN-GFP) embryo from 30-38hpf. The merged GFP (green) and RFP (red) images at 30, 34 and 38hpf are shown in the left column. In the right column, the boxed area in the 34hpf image is enlarged and subsequent time-lapse images are shown. Arrows indicate ECs undergoing nuclear fragmentation. (F) Percentage of NLS-GFP-expressing and TΔN-GFP-expressing ECs that undergo nuclear fragmentation in the CA and CVP between 30 and 38hpf. Data are expressed as a percentage of the total number of NLS-GFP-expressing and TΔN-GFP-expressing ECs, and shown as mean±s.e.m. NLS-GFP, n=5; TΔN-GFP, n=6. (G) Confocal stack fluorescence images of the 32hpf Tg(fli1:Gal4FF);(UAS:NLS-GFP) (left) and Tg(fli1:Gal4FF);(UAS:TΔN-GFP) (right) embryos with TUNEL staining. Arrows indicate TUNEL-positive ECs that express TΔN-GFP. (H) Percentage of TUNEL-positive cells among the NLS-GFP- or TΔN-GFP-expressing ECs in the CA and CVP at 32hpf. Data are mean±s.e.m. NLS-GFP, n=10; TΔN-GFP, n=9. CA, caudal artery; CV, caudal vein; CVP, caudal vein plexus. (F,H) ***P<0.01; n.s., not significant. Scale bars: 50µm.
|
