
Fig. 4
- ID
- ZDB-FIG-150309-37
- Publication
- Angers et al., 2014 - Itch Is Required for Lateral Line Development in Zebrafish
- Other Figures
- All Figure Page
- Back to All Figure Page
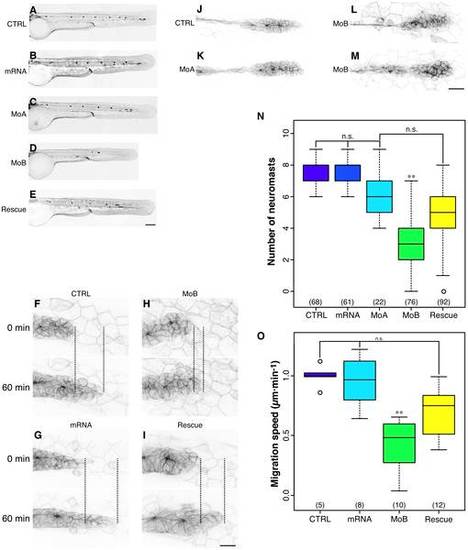
itchb is involved in pLL primordium migration and lateral line development. (A–E) Posterior lateral line at 48 hpf cldnb:gfp in embryos injected with vehicle (CTRL), in vitro-transcribed human ITCH mRNA (mRNA), MOs against itcha (MoA), MOs against itchb (MoB) or MOs against itchb and in vitro-transcribed human ITCH mRNA (Rescue). There was a marked reduction in the number of neuromasts in the pLL after itchb knockdown (D), but not in itcha knockdown, although the primordium had not yet reached the end of the tail at this time point (C). The itchb knockdown effect was partially rescued by injection of human ITCH mRNA (E). (F–I) Time-lapse confocal microscopy on 26–30 hpf cldnb:gfp embryos showed that the pLL primordium migration was slowed in itchb knockdown embryos (MoB) compared to vehicle (CTRL), human ITCH mRNA-injected (mRNA) or rescued embryos. (N) The number of neuromasts in the posterior lateral-line was counted after staining with DiAsp in 72 hpf WT embryos injected with vehicle (CTRL), in vitro-transcribed human ITCH mRNA (mRNA), MOs against itcha (MoA), MOs against itchb (MoB) or MOs against itchb and in vitro-transcribed human ITCH mRNA (Rescue). Whereas the number of neuromasts in the pLL was markedly reduced after injection of MOs against itchb, injection of in vitro transcribed ITCH mRNA alone or of MOs against itcha had no effect. The MOs phenotype was rescued by co-injection of ITCH mRNA in itchb knockdown. The number of embryos for each group is indicated at the bottom of the graph. ** represents statistical significance at p < 0.01. n.s. = non-significant. (J–M) Morphology of the migrating primordium in 26 hpf embryos (CTRL), itcha knockdown embryos (MoA) and itchb knockdown embryos (MoB). Cells at the tip of the primordium of MoB embryos were slightly disorganized, but the typical rosette formation occurred normally. (O) Migration of the pLL primordium was quantified by measuring the distance between the primordium leading edge in the first frame (t=0) compared to the last frame (t=60) as shown in F–I (doted line). The number of embryos counted or imaged is indicated at the bottom of the graph. Each graph summarizes four different experiments. ** represents statistical significance at p <0.01. n.s. = non-significant. EGFP fluorescence is presented as reversed black and white to facilitate visualization in all micrographs. Scale bars: (A–E) 34 µm, (F–I) 22 µm, (L–M) 40 µm. |
| Fish: | |
|---|---|
| Knockdown Reagents: | |
| Observed In: | |
| Stage Range: | Prim-5 to Long-pec |