
Fig. 3
- ID
- ZDB-FIG-150304-26
- Publication
- Campbell et al., 2013 - Local caspase activation interacts with Slit-Robo signaling to restrict axonal arborization
- Other Figures
- All Figure Page
- Back to All Figure Page
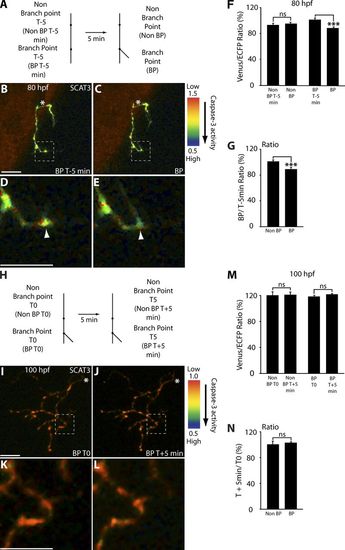
Caspase activity rapidly increases upon young RGC arbor branch tip formation. (A) Imaging analysis scheme for 80-hpf arbors expressing SCAT3-forming branches during the 5-min imaging interval. Branch points were determined as covering a distance of 2 μm or less away from where a branch tip joins, and arbor nonbranch points were 5–20 μm away from a branch tip and 3 μm in length, covering the width of the branches as for surrounding regions (Fig. 1). (B–E) Representative IMD images of an 80-hpf RGC arbor expressing SCAT3. Caspase activation is represented by the pseudocolors that correspond to the Venus/ECFP ratio 1.5–0.5 or 1.0–0.5. Red represents low caspase activation, and violet represents high caspase activation. (B–D) 5 min before branch point formation (BP T 5 min; B) and after branch tip (BP) formation (C). The region enclosed by the dashed squares in B and C are magnified in D and E. (F and G) Quantification of the Venus/ECFP ratio (F) comparing changes in arbors between regions that do or do not lead to the formation of branch points as in the scheme in A and presented as ratios (G). (H) Imaging analysis scheme for 100-hpf arbors expressing SCAT3 that are stable during the 5-min imaging interval. (I–L) Representative IMD images of a 100-hpf RGC arbor expressing SCAT3 that possesses branch points (BP T0; I), which remain stable during the 5-min imaging interval (BP T + 5 min; J). The regions enclosed by the dashed squares in I and J are magnified in K and L. (M and N) Quantification of the Venus/ECFP ratio (M) comparing changes in arbors between stable branch tips and regions that do not form branch tips as in the scheme in H and presented as ratios (N). White arrowheads depict the region in D that will become a branch point in E. White asterisks indicate the parent axon. 37 branch point additions and nonbranch points in six arbors were analyzed for 80-hpf arbors. 30 stable branch points from seven arbors were analyzed for 100-hpf arbors. Dorsal views are shown, and anterior is up. Error bars represent SEMs. ***, P < 0.001. Bars, 10 μm. |