
Fig. 3
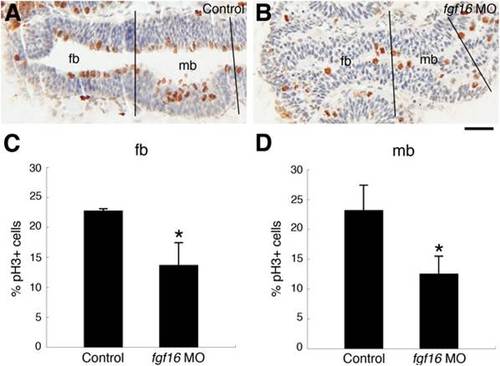
Comparison of cell proliferation and cell death patterns in control embryos and fgf16 morphants. (A, B) Control embryos (A) and embryos injected with fgf16 MO (B) were stained using an anti-H3P antibody. Panels show representative horizontal sections of the head region at 24 hpf. (C, D) The percentage of proliferating cells labelled with the anti-pH3 antibody in the forebrain (C) and midbrain (D) of control embryos and embryos injected with fgf16 MO. Results are the mean ± S.D. for three independent sections from three embryos. The significance of differences in mean values was assessed with the Student’s t-test. Asterisks indicate significant differences from the control (*P<0.05). The forebrain (fb) and midbrain (mb) regions, which we defined in the sections, are separated by black lines. Scale bar: 25 µm. |
| Fish: | |
|---|---|
| Knockdown Reagent: | |
| Observed In: | |
| Stage: | Prim-5 |