
Fig. 3
- ID
- ZDB-FIG-150205-3
- Publication
- van der Vaart et al., 2014 - The DNA Damage-Regulated Autophagy Modulator DRAM1 Links Mycobacterial Recognition via TLR-MYD88 to Autophagic Defense
- Other Figures
- All Figure Page
- Back to All Figure Page
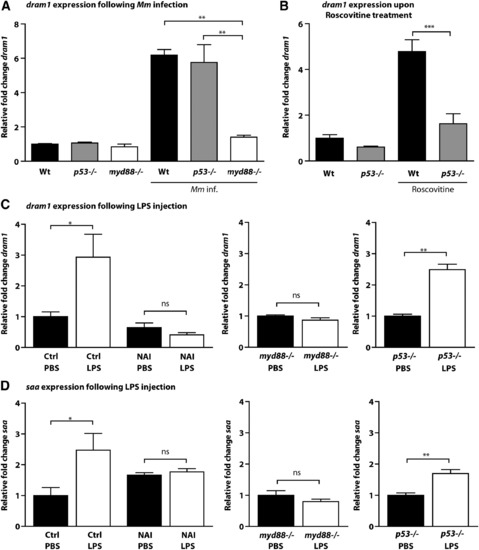
dram1 Expression during Mycobacterial Infection Is Independent of p53 but Dependent on NF-κB (A-C) Expression levels of dram1 were determined by qPCR for (A) wild-type, p53-/-, and myd88-/- embryos 4 days after infection with Mm, relative to mock-injected controls; (B) wild-type and p53-/- embryos at 5 dpf after 24 hr of treatment with roscovitine, relative to untreated controls (see also Figure S3); and (C) 1 dpf embryos at 2 hpi with LPS, relative to their respective PBS-injected controls (left panel: wild-type embryos with or without NAI treatment [4 hr total, including 2 hr pretreatment]; middle panel: myd88-/- embryos; right panel: p53-/- embryos). (D) Expression levels of saa were determined by qPCR under the same conditions as those described for (C). All graphs show data (mean ± SEM) from three biological replicates with n = 20 embryos pooled per replicate. See also Figures S2 and S3. |