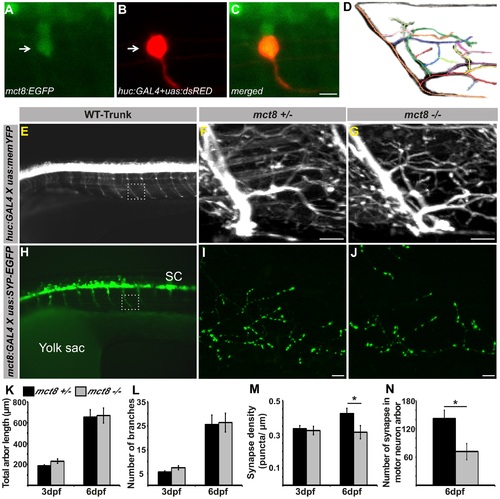
Loss of MCT8 reduces synaptic density in axonal arbors of the motor neuron. A-C. Confocal imaging of a 2 dpf live tg(mct8:EGFP) embryo co-injected with huc:GAL4 and uas:tRFP constructs revealed co-localization of mct8 (green) and the huc pan-neural marker (red) in a motor neuron. D. Schematic illustration of an axonal arbor in a motor neuron. Each color represents a single branch that was subjected to ImageJ software analysis. E. Lateral view of a 3 dpf tg(huc:GAL4Xuas:memYFP) embryo. memYFP expression driven by the huc promoter is observed in the spinal cord (SC) and in descending motor neurons. The dashed frame marks a single motor neuron that was selected for further comparative studies. High magnification of the framed area is shown in the trunk of 6 dpf tg(huc:GAL4Xuas:memYFP)/mct8+/- and tg(huc:GAL4Xuas:memYFP)/mct8-/- representative larvae (F and G, respectively). H. Lateral view of a 30 hpf tg(mct8:GAL4Xuas:SYP-EGFP) embryo. SYP-EGFP expression driven by the mct8 promoter is observed in the spinal cord (SC) and in descending motor neurons. In order to compare the number of synapses in mct8+/- and mct8-/- larvae, single motor-neuron arbors were selected (dashed frame). High magnification of the dashed frame is shown in 6 dpf tg(mct8:GAL4)/(uas:SYP-EGFP)/mct8+/- and tg(mct8:GAL4)/(uas:SYP-EGFP)/mct8-/- representative larvae (I and J, respectively). The total arbor length (K) and the number of branches (L) were measured in 3 and 6 dpf mct8+/- larvae and in 3 and 6 dpf mct8-/- larvae. M. Synapse density in the axons of the motor-neurons was measured along the last 50 µm of a single branch in 3 and 6 dpf mct8+/- larvae and in 3 and 6 dpf mct8-/- larvae. N. The total number of synapses was measured in the motor-neuron arbor of 6 dpf mct8+/- and mct8-/- larvae. Scale bar = 30 µm. Values represented as means±SEM (standard error of the mean). Statistical significance determined by t-test: Two-sample assuming unequal variances followed by one-sample Kolmogorov-Smirnov test, to assume normal distribution (*p<0.05).
|
