
Fig. 2
- ID
- ZDB-FIG-150121-14
- Publication
- Wanglar et al., 2014 - Tbx Protein Level Critical for Clock-Mediated Somite Positioning Is Regulated through Interaction between Tbx and Ripply
- Other Figures
- All Figure Page
- Back to All Figure Page
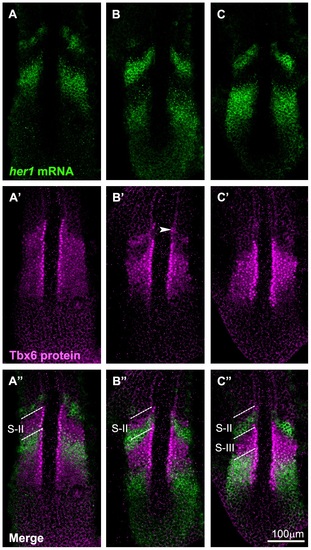
Spatial pattern of the Tbx6 protein (A′-C&prime& magenta) is compared with those of her1 mRNA (A-C; green) at 3 different phases of segmentation cycle at around the 8 somite stage. Merged images are also indicated (A′′-C′′). According to the general nomenclature [39], the phases shown in A, B, and C appear to correspond to the phase III, I, and II, respectively. (B-B′′) Anterior Tbx6 starts to disappear with some remains (the upper band: arrowhead) (B′). (C-C′′) The upper band of Tbx6 disappears and the next Tbx6 anterior border shifts posteriorly. (A-A′′) The core domain was extended posteriorly. Out of a total of 42 embryos examined, around 35% of them showed A type, 41% showed B type, 24% showed C type of expression. The dotted lines indicate S-II (A′′, B′′) and S-II, S-III (C′′) regions. |
| Genes: | |
|---|---|
| Antibody: | |
| Fish: | |
| Anatomical Term: | |
| Stage: | 5-9 somites |