
Fig. S3
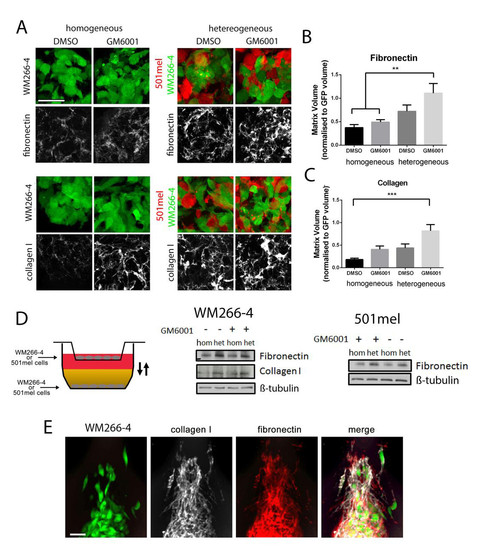
Characterisation of matrix deposition in xenografts. (Related to Figure 4.) (A) Cryosections of homogeneous or heterogenous xenografts treated either with the vehicle control DMSO, or the pan-MMP inhibitor GM6001 and stained for fibronectin (upper panels) and collagen I (lower panels). (B) Quantification of fibronectin fluorescence intensity volume normalised to WM266-4 (GFP) volume of homogeneous and heterogeneous xenografts; mean ± SEM; one-way ANOVA followed by Tukey’s multiple comparisons test; N ≥ 9 from 3 independent experiments. (C) Quantification of collagen I fluorescence intensity volume normalised to WM266-4 (GFP) volume of homogeneous and heterogeneous xenografts; mean ± SEM; Kruskal-Wallis followed by Dunn’s multiple comparisons test N e 9 from 3 independent experiments. (D) Western blot showing collagen I or fibronectin expression in either WM266-4 cells (middle panels) or 501mel (right panels) co-cultured either with autologous cells (hom) or heterologous cells (het; as depicted in the cartoon, left). Furthermore, cells were either treated with DMSO or a cocktail of protease inhibitors. (E) Wholemount immunofluorescence labelling of both fibronectin and collagen I in homogeneous WM266-4 xenografts at 4 dpi. Scale bars = 50 μm. |