
Fig. 1
- ID
- ZDB-FIG-140811-18
- Publication
- Ju et al., 2014 - Activation of Sonic hedgehog signaling in neural progenitor cells promotes glioma development in the zebrafish optic pathway
- Other Figures
- All Figure Page
- Back to All Figure Page
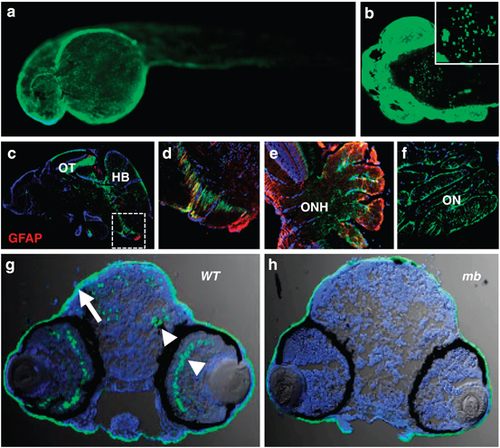
GFP expression patterns in the Tg(krt5:EGFP) line. (a) Skin epithelia expression in a 24h.p.f. embryo (side view, anterior to the left). (b) Confocal imaging of GFP-positive cells in the brain of a 72h.p.f. larva (dorsal view, anterior left). (c) Saggital cryosection of an adult fish brain showing GFP expression in the ventricular zones, the OT and the hindbrain (HB). (d) Zoomed-in view of the white frame in (c) showing GFP-positive cells in the ventricular zones resembling radial glia cells partially positive for GFAP (red). (e) GFP expression in the ONH showing little overlap with the retinal Müller glial marker GFAP (red). (f) GFP expression in the reticular astrocytes of the ON. (g) Transverse section through the brain region of a wild-type (WT) 72h.p.f. larva showing GFP expression in the skin (arrow), brain and retina (arrowheads). (h) GFP expression in the brain and the retina was absent in the mindbomb (mb) mutant background, whereas expression in the skin was not affected. All crysections were counterstained with 4′,6-diamidino-2-phenylindole (DAPI) to label nuclei (blue). |
| Gene: | |
|---|---|
| Antibody: | |
| Fish: | |
| Anatomical Terms: | |
| Stage Range: | Prim-5 to Adult |