
FIGURE
Fig. S4
Fig. S4
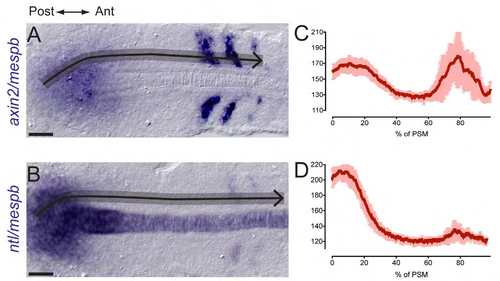
Intensity profiles of axin2 and notail (ntl) along normalized antero-posterior PSM length, related to Figure 4. (A,B) Dorsal view of flat mounted PSM of wild-type embryos at 12 (A) or 10 (B) somites, stained for axin2 and mespb (A) or ntl and mespb (B). (C,D) Average intensity profiles from several embryos obtained from color-inverted pictures, within a line of interest that spans the PSM (see black arrows in A and B). The grey shading indicates the width of the Line of Interest used for measurements. Mean ± SD. Scale bar is 50µm. |
Expression Data
Expression Detail
Antibody Labeling
Phenotype Data
Phenotype Detail
Acknowledgments
This image is the copyrighted work of the attributed author or publisher, and
ZFIN has permission only to display this image to its users.
Additional permissions should be obtained from the applicable author or publisher of the image.
Full text @ Development