
Fig. S3
- ID
- ZDB-FIG-140527-17
- Publication
- Jiang et al., 2014 - Gene-expression analysis of hair cell regeneration in the zebrafish lateral line
- Other Figures
- All Figure Page
- Back to All Figure Page
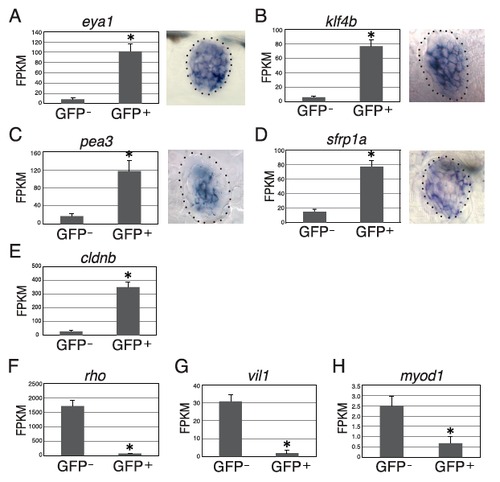
GFP and GFP+ cells from control Tg(sqET20) larvae were analyzed for gene expression by using FPKM levels from RNA-Seq. (A–D) (Right) In situ hybridization indicates that eya1 is expressed in all neuromast cells, klf4b and pea3 are expressed in inner support cells, and sfrp1a is expressed in mantle cells and some inner support cells. (A–D, Left and E) Expression of eya1 (A), klf4b (B), pea3 (C), sfrp1a (D), and cldnb (E) is increased significantly in GFP+ cells compared with GFP cells, indicating that not only mantle but also inner support cells are enriched in GFP+ cells. (F–H) The retina marker rho (F), gut marker vil1 (G), and skeletal muscle marker myod1 (H) are expressed at very low levels in GFP+ cells. All results are presented as mean ± SD; *P < 0.01 by t test. |