|
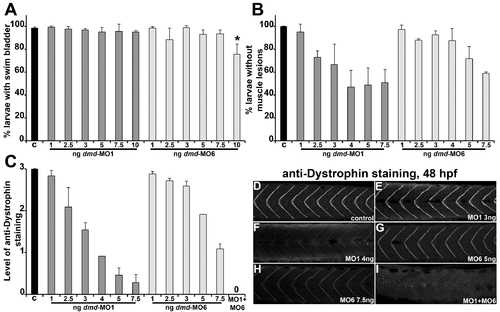
Identification of morpholino doses for zebrafish dmd knockdown. (A-C) Graphs of dmd morpholino (MO) effects. (A) Swim bladders were scored at 5 dpf. For each bar, n=3 with e25 larvae for each replicate. * P<0.04 versus control. (B) Muscle lesions were scored based on acta1a:gfp expression at 2 dpf. For each bar, n=3 with e30 larvae for each replicate. (C) Anti-Dystrophin staining was performed at 48 hpf. X-axes show ng of MO injected; c refers to controls. Anti-Dystrophin staining levels are arbitrary units. For each bar, n=2-3 with e12 larvae for each replicate. (D-I) Anti-Dystrophin staining in 48 hpf larvae. Lateral views of trunk somites show anterior to the left. Staining accumulates at myotome boundaries (Bassett et al., 2003; Guyon et al., 2003). In (C) and (I), MO1+MO6 refers to MO1 4 ng/MO6 7.5 ng combination.
|