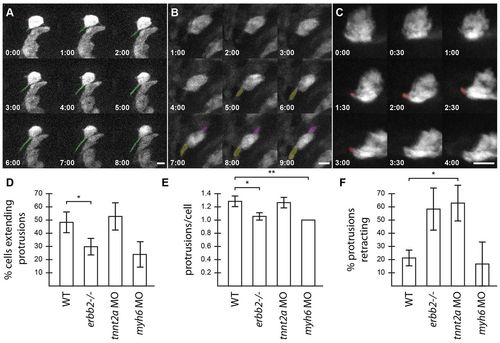
Trabecular-deficient animals exhibit different modes of trabecular failure. (A-C) Examples of distinct cardiomyocyte behavior: (A) a cardiomyocyte extending a single protrusion (green); (B) a cardiomyocyte extending two protrusions (purple and yellow); and (C) a cardiomyocyte extending a protrusion which then retracts over the next 2 hours (red). Scale bars: 10 μm. (D-F) Quantification of the properties and behavior of myocardial protrusions in trabecular-deficient backgrounds. Error bars indicate s.e.m. Data were collected from 97 WT cells (14 embryos, 59 processes), 40 tnnt2a morphant cells (seven embryos, 32 processes), 37 erbb2 mutant cells (six embryos, 14 processes) and 20 amhc morphant cells (four embryos, eight processes). (D) The number of cardiomyocytes extending protrusions as a proportion of the total number of cardiomyocytes counted. (E) The number of protrusions per cardiomyocyte that extended at least one protrusion. (F) The number of protrusions that retracted in length during a 10-hour movie, as a proportion of the total number of protrusions observed in each set of embryos. *P<0.05, **P<0.005. WT, wild type.
|
