
Fig. 7
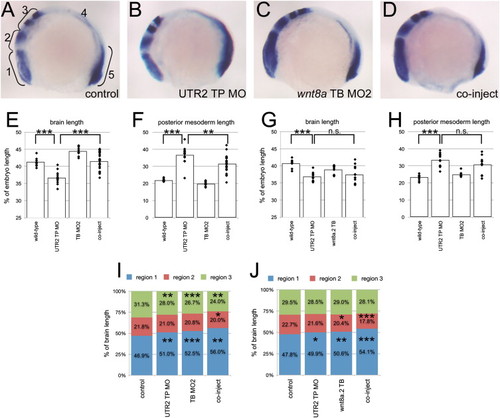
Results of rescue experiment. (A–D) Examples of embryos in the four treated groups, lateral views, anterior left. Treatment indicated in lower right corner. (A) Brackets indicate the five different segments measured in each embryo. Region 4 spans from the posterior edge of egr2b to the anterior limit of tbx6l+ staining. (E–H) Plots of measurement data. (E and G) Length of regions 1–3 relative to total embryo length. (F and H) Length of region 5 relative to total embryo length. Diamonds are measurements for individual embryos. Bars show mean values. NNNp<0.001; NNp<0.01; n.s.: not significant. (I and J) Length of regions 1, 2 and 3 relative to the total length of region 1–3. Numbers are percent values for each region. Np<0.05; NNp<0.01; NNNp<0.001. |
| Fish: | |
|---|---|
| Knockdown Reagent: | |
| Observed In: | |
| Stage: | 5-9 somites |
Reprinted from Developmental Biology, 386(1), Wylie, A.D., Fleming, J.A., Whitener, A.E., and Lekven, A.C., Post-transcriptional regulation of wnt8a is essential to zebrafish axis development, 53-63, Copyright (2014) with permission from Elsevier. Full text @ Dev. Biol.