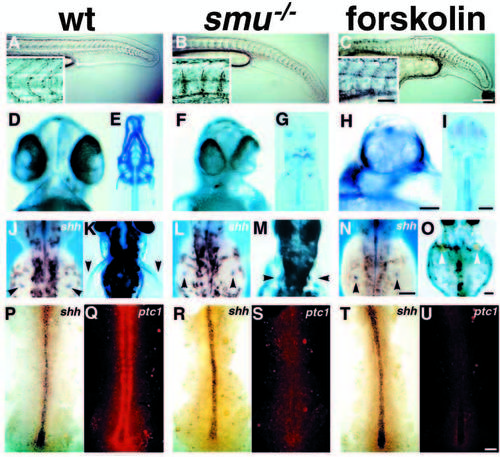
smu mutant phenotypes resemble those seen in forskolin treated embryos. (A-C) Side views of 24h live embryos; insets show higher magnification views of somite morphology. Wild-type embryos (A) have typical chevron-shaped somites while smu-/- (B) and forskolin-treated (C) embryos have blocky, U-shaped somites and ventrally curled tails. (D,F,H) Ventral views of live 48h embryos. The eyes in wild-type embryos (D) are separated, whereas smu-/- (F) and forskolin-treated (H) embryos have partial cyclopia. (E,G,I) Ventral views of Alcian Bluestained 3.5d embryos. Jaw, head, fin and trunk cartilage is well developed in wild-type embryos (E), while smu-/- (G) and forskolin-treated (I) embryos have a nearly complete loss of jaw and head cartilage. Trunk cartilage is similar in wild-type, smu-/- and forskolin-treated embryos. (J,L,N) Dorsal views of 36h embryos labeled by in situ hybridization for shh. The fin buds (arrowheads) of wild-type (J), smu-/- (L), and forskolin-treated (N) embryos all express shh in a similar pattern. (K,M,O) Dorsal views of live 3d embryos. Pectoral fins (arrowheads) are well developed in wild-type embryos (K), whereas pectoral fins are severely reduced in smu-/- (M) and forskolin-treated (O) embryos. (P-U) Dorsal views of shh (blue) and ptc1 (red) expression in 12h embryos. A white light (P,R,T) and a fluorescence (Q,S,U) image of each embryo is shown. Wild-type (P), smu-/- (R), and forskolin-treated (T) embryos express shh similarly in the notochord. Wild-type (P,Q) embryos express high levels of ptc1 in paraxial mesoderm cells adjacent to the notochord. smu-/- (R,S) and forskolin-treated (T,U) embryos do not express detectable ptc1 in the paraxial mesoderm. All images are oriented such that anterior is to the left (side views) or to the top (dorsal and ventral views). Bars: 200 μm (A-C); 50 μm (A-C insets); 50 μm (D,F,H); 100 μm (E,G,I); 100 μm (J,L,N); 100 μm (K,M,O); 50 μm (P-U).
|
