
Fig. 2
- ID
- ZDB-FIG-140225-2
- Publication
- Lee et al., 2013 - Hexanucleotide Repeats in ALS/FTD Form Length-Dependent RNA Foci, Sequester RNA Binding Proteins, and Are Neurotoxic
- Other Figures
- All Figure Page
- Back to All Figure Page
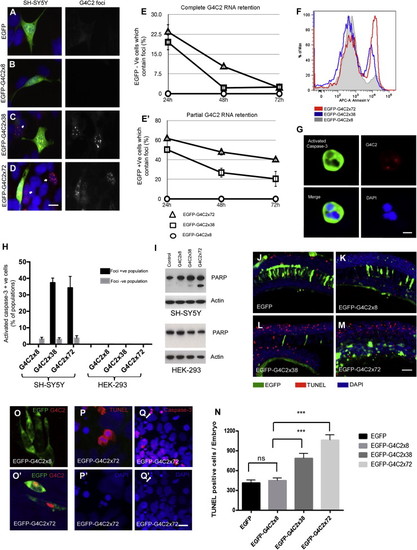
Loss of G4C2 Foci-Positive Cells Is Due to Apoptotic Cell Death in Culture and In Vivo (A–D) SH-SY5Y cells were transfected with EGFP-tagged G4C2 constructs. G4C2 RNA foci (red) were found only in cells transfected with EGFP-G4C2 38× and EGFP-G4C2 72× repeats. Many cells with RNA foci were negative for EGFP (arrows in C and D), implying near-complete nuclear retention. Nuclei were stained with DAPI (blue) (scale bar represents 10 μm). (E) The percentage of cells with G4C2 foci by FISH that did not express EGFP were counted at 24, 48, and 72 hr posttransfection (E), as were foci-positive cells that did express EGFP (E’). Foci-positive cells declined in number, most markedly in those showing greater nuclear retention (EGFP). In all experiments, a total of 250 cells from three independent transfections were counted, and results are presented as mean ± SD. (F) EGFP-tagged G4C2 plasmids were transfected into SH-SY5Y cells, stained with the early apoptosis marker Annexin V, and analyzed by FACS. Cells expressing 38× and 72× repeats showed 3- or 5-fold higher levels of Annexin V, respectively, than did cells expressing 8× repeats. (G) G4C2 foci-positive SH-SY5Y cells were found positive for activated caspase-3 (scale bar represents 5 μm). (H) G4C2 RNA foci-positive SH-SY5Y cells, but not HEK293 cells, express activated caspase-3. Caspase-3 activation was scored in 250 foci-positive cells per coverslip, and three coverslips were analyzed per experiment. The background level of active caspase-3 was estimated by counting the frequency of active caspase-3-positive cells in the foci-negative population. (I) Western blot of PARP cleavage in control or G4C2-transfected SH-SY5Y and HEK293 cells. Actin was used as a loading control. (J–M) Apoptotic cell death was analyzed by TUNEL staining in zebrafish prim-5 embryos injected with plasmids mosaically expressing EGFP (J), EGFP-G4C2 8× (K), EGFP-G4C2 38× (L), or EGFP-G4C2 72× (M). The number of TUNEL-positive cells (red) increased in the embryos injected with 38× and 72× repeats (L and M) (scale bar represents 200 μm). (N) Quantification of all embryos (n = 5) from three independent experiments is presented. Error bars show the standard error for each sample, and p values (p < 0.0001, ) are also determined. (O) G4C2 RNA foci (red) were found only in zebrafish embryo cells injected with 72×, but not with 8× repeats. EGFP expression is green. (P and Q) High-resolution images of TUNEL-positive (P and P2) and active caspse-3 (Q and Q2) from zebrafish embryo cells injected with 72× (scale bar represents 10 μm). Nuclear staining is blue. See also Figure S2 |