
Fig. 7
- ID
- ZDB-FIG-140204-37
- Publication
- Winata et al., 2013 - Genome wide analysis reveals zic3 interaction with distal regulatory elements of stage specific developmental genes in zebrafish
- Other Figures
- All Figure Page
- Back to All Figure Page
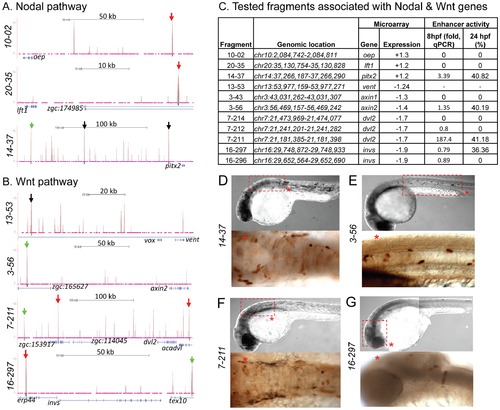
Zic3 binding sites associated with genes from the Nodal and Wnt pathway genes. UCSC browser image depicting genomic locations of Zic3 peaks identified near Nodal (A) and Wnt (B) pathway genes at 8 hpf. Single black vertical bars below histogram - peaks called by QuEST algorithm, blue horizontal bars - annotated exons (tall boxes), UTRs (half-sized boxes), introns (lines, arrowheads denote transcript orientation); Zic3 binding sites with negative (red arrows) and positive (green arrows) enhancer activity. Scale bars are indicated by black horizontal line at the top of each panel. C, list of tested fragments associated with Nodal and Wnt pathway genes. Enhancer-driven expression was assayed by qRT-PCR of gfp at 8 hpf and through microscopic observation of GFP expression pattern at 24 hpf. Between 50 to 100 embryos were assayed in each experimental time point. D–G, representative figure of gfp expression driven by selected fragments of Zic3 binding sites in F0 embryos at 24 hpf, immunostained with anti-GFP antibody. D*, F*, dorsal view; E*, G*, lateral view. |