
Fig. 4
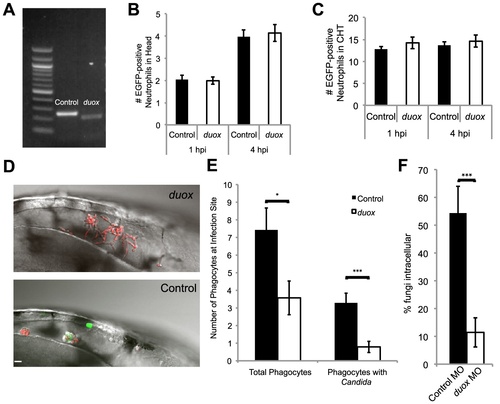
Duox knockdown phenocopies p47phox knockdown and DPI treatment. (A–F) Control and Duox morpholinos were co-injected with p53 morpholino into 1-cell stage Tg(mpx:GFP)i114 zebrafish embryos to create morphants. (A) Samples were collected and prepared for RT-PCR verification of morpholino knockdown. A 39 base pair deletion in the duox message is observed in morphants. (B) Basal level of neutrophils in head at time of infection. Control and duox morphant Tg(mpx:GFP)i114 fish were injected at the prim25 stage with PBS to simulate infection. At 1 hpi and 4 hpi neutrophils in the head were counted at 1 hpi; n = 68 controls and 77 duox morphants, at 4 hpi n = 70 controls and 71 duox morphants. Data pooled from 5 independent experiments. (C) Basal levels of neutrophils in caudal hematopoetic tissue (CHT). Control and duox morphant Tg(mpx:GFP)i114 fish were PBS-injected at the prim25 stage and imaged at 1 hpi and 4 hpi. Data shown are representative of three independent experiments; n = 16 control and n = 13 duox morphants. (D–F) Phagocyte migration. Control (n = 15) and duox (n = 15) morphant Tg(mpx:GFP)i114 fish were injected at the prim25 stage with CAF2-dTomato and imaged until 4 hpi. (D) Representative images of infection site show severe reduction in phagocytosis and extensive extracellular filamentous growth in duox morphants (top) compared with controls (bottom). Scale bar = 10 μm. Representative of three independent experiments. (E) Phagocytes were counted at the site of infection at 4 hpi. Total phagocytes includes all EGFP+ neutrophils and EGFP- phagocytes that internalized fungi. Phagocytes with Candida includes only phagocytes with internalized fungi. Data from all experiments was pooled and the average and standard error of all fish are shown. (F) At 4 hpi, fungi were scored as intracellular or extracellular, and the percent internal was calculated per fish. Data from three independent experiments were pooled and the average per fish and standard error are shown. *p<0.05 **p<0.01 ***p<0.001. |
| Gene: | |
|---|---|
| Fish: | |
| Knockdown Reagents: | |
| Anatomical Terms: | |
| Stage: | Prim-25 |
| Fish: | |
|---|---|
| Knockdown Reagents: | |
| Observed In: | |
| Stage: | Prim-25 |