
Fig. 3
- ID
- ZDB-FIG-140122-7
- Publication
- Iwasaki et al., 2013 - Expression of Arginine Vasotocin Receptors in the Developing Zebrafish CNS
- Other Figures
- All Figure Page
- Back to All Figure Page
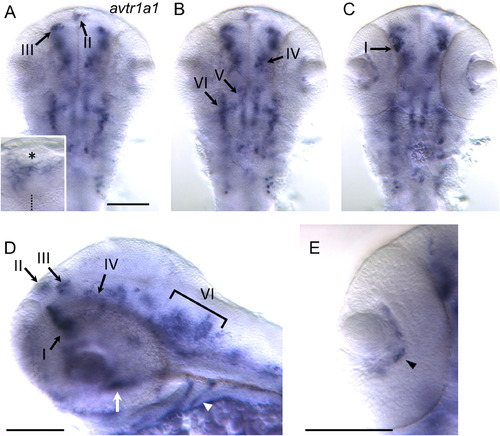
More neurons express avtr1a1 at 48 hpf. (A) View of the brain focused dorsally showing avtr1a1+ cells in the base of the epiphysis (II) and the forebrain/tectum boundary (III). Inset shows a higher magnification view of the cluster II avtr1a1+ cells with asterisk denoting the epiphysis and dotted line the midline. Scale: 100 µm for (A-C). (B) Same view focused more ventrally than (A) showing the avtr1a1+ cells at the forebrain/tegmentum boundary (IV) and two rough stripes of cells that cross the midbrain/hindbrain boundary (V and VI). (C) Same view focused even more ventrally showing the anterior forebrain avtr1a1+ cells (I). (D) Lateral view showing the avtr1a1+ cells in the anterior forebrain (I), near the dorsal midline of the forebrain (II), at the forebrain/tectum boundary (III), at the forebrain/tegmentum boundary (IV) and the lateral stripe near the midbrain/hindbrain boundary (VI). Outside the brain the pharyngeal arches (arrowhead) and a midline structure in between the eyes (arrow) also express avtr1a1. Scale: 100 µm. (E) View of eye showing avtr1a1+ cells (arrowhead) between the lens and the retina. Scale: 100 µm. |
| Gene: | |
|---|---|
| Fish: | |
| Anatomical Terms: | |
| Stage: | Long-pec |
Reprinted from Gene expression patterns : GEP, 13(8), Iwasaki, K., Taguchi, M., Bonkowsky, J.L., and Kuwada, J.Y., Expression of Arginine Vasotocin Receptors in the Developing Zebrafish CNS, 335-42, Copyright (2013) with permission from Elsevier. Full text @ Gene Expr. Patterns