
Fig. 5
- ID
- ZDB-FIG-131220-46
- Publication
- Chen et al., 2013 - Cross-species array comparative genomic hybridization identifies novel oncogenic events in zebrafish and human embryonal rhabdomyosarcoma
- Other Figures
- All Figure Page
- Back to All Figure Page
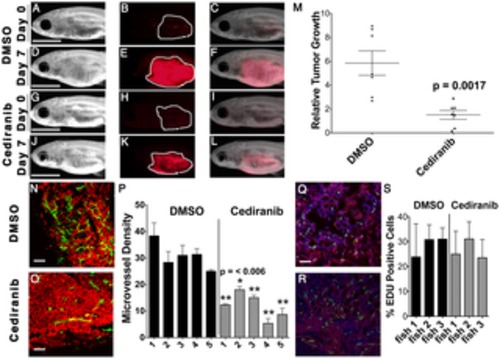
Figure 5. Chemical inhibition of VEGF signaling by cediranib reduces ERMS growth in vivo. Syngeneic CG1 fish were transplanted with ERMS cells that co-expressed rag2-KRASG12D and rag2-dsRED. Fish with engrafted tumors were treated with DMSO vehicle (A–F) or 100 nM of cediranib for 7 days (G–L). Pre-treatment (A–C and G–I) and post-treatment images (D–F and J–L) of representative fish. Bright field (A,D,G,J), dsRED fluorescence (B,E,H,K) and merged image planes (C,F,I,L). Scale bar is 3 mm. (M) Quantification of relative volume change for individual animals. (N–O) fli1-GFP transgenic zebrafish were transplanted with dsRED-labeled ERMS and treated with DMSO (N) and cediranib (O). Scale bar equals 50 μm. (P) Microvessel density quantification. Asterisk indicates statistically significant difference between DMSO and cediranib-treated groups based on student t-test. Each error bar indicates standard deviation from 3 fields of microvessels for each animal. EDU incorporation analysis in DMSO (Q) or cediranib (R) treated fish. Scale bar is 50 μm. (S) Quantification of EDU analysis across each cohort of animals. Each error bar indicates standard deviation of percent EDU+ cells found within 3 fields for each animal. |