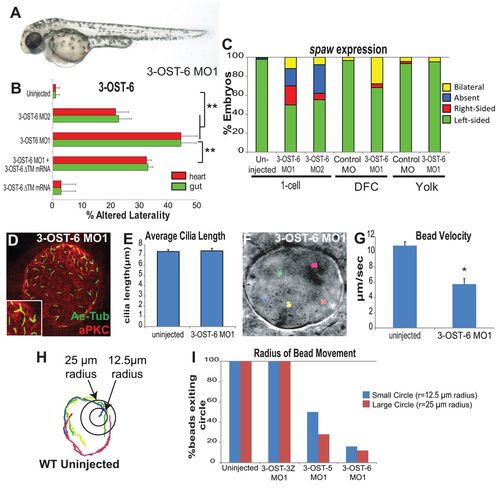
3-OST-6 cell-autonomously controls KV cilia motility and LR patterning, but not cilia length. (A) 3-OST-6 morphant at 48 hpf. Except for heart and gut anomalies, 3-OST-6 morphants were indistinguishable from WT embryos at the gross level. (B) Percentages of reversed heart and gut looping in 3-OST-6 morphants (MO1: n=172, **P<0.001; MO2: n=89, **P<0.001) were increased compared with uninjected embryos (n=411). Co-injection of 3-OST-6 MO1 and MO-resistant 3-OST-6ΔTM ‘rescue’ mRNA resulted in a significant rescue of heart and gut orientation (n=184; **P<0.001). Overexpression of 3-OST-6ΔTM mRNA alone did not alter normal heart and gut looping (n=140). Error bars represent s.d. (C) Percentages of left-sided, right-sided, absent, and bilateral spaw in 3-OST-6 morphants (MO1, n=159; MO2, n=165; uninjected, n=220). DFC3-OST-6 MO1 embryos (n=150) showed a high level of bilateral spaw expression, statistically distinct (**P<0.001) from controls: DFCControl MO (n=145), Yolk3-OST-6 MO1 (n=79), and YolkControl MO (n=90). (D) 3-OST-6 morphants had normal KV cell differentiation (red) and normal cilia length (green) that was comparable to control embryos (see Fig. 2A). (E) 3-OST-6 MO (920 cilia, 18 embryos, 8 SS) had cilia lengths comparable to uninjected embryos (P<0.85). Error bars represent s.e.m. (F) 3-OST-6 MO1 morphants lacked directed movement of beads injected into KV. Each color represents a single tracked bead. (G) Average velocity of fluorescent beads injected into KV. Flow velocity was significantly decreased in 3-OST-6 MO1 (five embryos, five beads/embryo; **P<0.001) compared with controls (see Fig. 2D; supplementary material Movies 1 and 2). Error bars represent s.d. (H) Radius of bead movement assay. Concentric circles were placed at bead start. Beads were scored as exiting the inner circle with a radius of 12.5 µm and/or outer circle with a radius of 25 µm. Each color represents a single tracked bead. (I) Quantification of the radius of bead movement.
|
