|
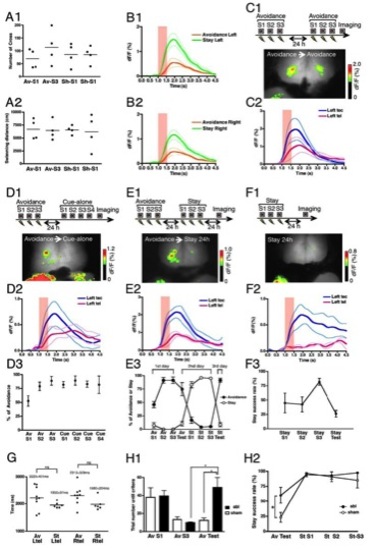
(A1, A2) Behaviors of fish which were trained by the Avoidance task then exposed to the electric shocks alone during adaptation periods.
(A1) The number of crossing the hurdle during 20-minute adaptation periods before each session did not change between Avoidance and Shock-alone sessions.
(A2) The swimming distances during 20-minute adaptation periods before each session did not change between Avoidance and Shock only sessions. Av-S1: Avoidance-training session 1, Av-S3: Avoidance-training session 3, Sh-S1: Shock-alone session 1, Sh-S3: Shock-alone session 3.
(B) Time course analysis of calcium signals for Avoidance and Stay task memory retrieval. The mean +/- SEM was plotted.
(B1) Time course of calcium signals in the left telencephalon for Avoidance (orange) and Stay (green) task memory retrieval. Avoidance task, N=7; Stay task, N=6.
(B2) Time course of calcium signals in the right telencephalon for Avoidance (orange) and Stay (green) task memory retrieval. Avoidance task, N=7; Stay task, N=6.
(C-F) Control experiments for Avoidance task-then-Stay task conditioning.
(C1) (Above) Experimental schedule. Fish were trained by three sessions of the Avoidance task on the first day then by three sessions of Avoidance task again on the second day. (Below) An example of the calcium activity pattern of the fish which was trained by the Avoidance task twice.
(C2) Averaged temporal sequence of fluorescence change in the left optic tectum (blue line, Left tec) and the left telencephalon (pink line, Left tel). The mean +/- SEM is plotted. The cue presentation period was indicated with a red shadowed box. N=3.
(D1) (Above) Experimental schedule. Fish were trained by three sessions of the Avoidance task on the first day then by four sessions of the cue-alone exposure on the second day. (Below) An example of the calcium activity pattern of the fish which was trained by the Avoidance task then proceeded to the Cue-alone sessions.
(D2) Averaged temporal sequence of fluorescence change in the left optic tectum (blue line, Left tec) and the left telencephalon (pink line, Left tel). The mean +/- SEM is plotted. The cue presentation period was indicated with a red shadowed box. N=3.
(D3) The percentage of the avoidance response in each session. Dots and bars represent the mean +/- SEM, respectively. Even after four cue-alone sessions, the acquired avoidance responses were not extinguished. Av S1: Avoidance training session 1, Av S2: Avoidance training session 2, Av S3: Avoidance training session 3, Cue S1: Cue-alone session 1, Cue S2: Cue-alone session 2, Cue S3: Cue-alone session 3, Cue S4: Cue-alone session 4. N=4.
(E1) (Above) Experimental schedule. Fish were trained by the Avoidance task on the first day, then trained by the Stay task on the next day and tested 24 h after the last Stay conditioning. (Below) In fish trained by the Avoidance task first then by the Stay task, the calcium activity pattern in the telencephalon at 24 h was similar to that observed in fish trained by the Avoidance task alone at 24 h.
(E2) Averaged temporal sequence of fluorescence change in the left optic tectum (blue line, Left tec) and the left telencephalon (pink line, Left tel). The mean +/- SEM is plotted. The cue presentation period was indicated with a red shadowed box. N=4.
(E3) Dots and bars represent the mean +/- SEM, respectively. The success rate for the Avoidance task increased during Avoidance task training on the first day, then decreased during Stay task training on the second day, and recovered in the test session on the third day. The percentage for the Stay behavior remained low during Avoidance task on the first day, then increased during Stay task training on the second day. This high rate for the Stay behavior was not maintained on the third day. Av-S1: Avoidance task training session 1, Av-S2: Avoidance task training session 2, Av-S3: Avoidance task training session 3, Av-test: Avoidance task test session, St-S1: Stay task training session 1, St-S2: Stay task training session 2, St-S3: Stay task training session 3, St-test: Stay task test session. N=5.
(F1)(Above) Experimental schedule. Fish were trained by the Stay task and tested 24 h later. (Below) At 24 h after the Stay training, there was no apparent localized calcium signal in the telencephalon.
(F2) Averaged temporal sequence of fluorescence change in the left optic tectum (blue line, Left tec) and the left telencephalon (pink line, Left tel). The mean +/- SEM is plotted. The cue presentation period was indicated with a red shadowed box. N=2.
(F3) Dots and bars represent the mean +/- SEM, respectively. Although the success rate in the Stay task increased during the Stay training, this high success rate for the Stay task was not maintained 24 h after. Stay S1: Stay task training session 1, Stay S2: Stay task training session 2, Stay S3: Stay task training session 3, Stay test: Stay task test session. N=4.
(G) Peak time comparison. The comparison of the peak times between the curves of calcium signals of Avoidance and Stay task in the left and right telencephalon. There was no significant difference between the peak times of the Avoidance and Stay task in both telencephalic hemispheres (Left telencephalon, P=0.0931, unpaired t-test; Right telencephalon, P=0.0599, unpaired t-test). Av Ltel: Avoidance left telencephalon, Av Rtel: Avoidance right telencephalon, St Ltel: Stay left telencephalon, St Rtel: Stay right telencephalon.
(H) Ablation between the Avoidance task and the Stay task. In order to examine whether the Stay task learning is dependent on the Avoidance neural ensemble, we first trained fish by the Avoidance task then ablated the activated region, then trained them by the Stay task on the next day.
(H1) The activated area ablated fish showed the impairment of the memory 24 hours after the last conditioning. Columns and bars represent the mean +/- SEM, respectively. abl: ablated fish (black filled bar, N=4), sham: sham operated fish (white bar, N=3). Av S1: Avoidance conditioning session 1, Av S3: Avoidance conditioning session 3, Av Test: Avoidance conditioning test session. Av S3 abl vs. Av Test abl; P*<0.05, Paired t-test. Av S3 sham vs. Av Test abl; P*<0.05, Unpaired t-test.
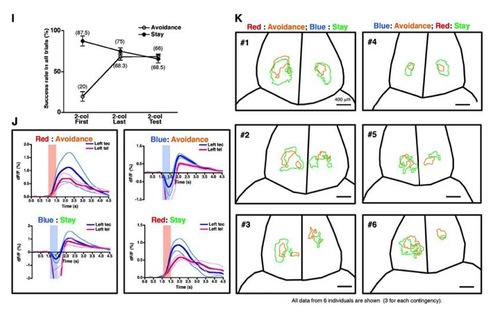
(H2) Circles and bars represent the mean +/- SEM, respectively. The higher Stay rate in the ablated fish in comparison with that in the sham operated fish reflects the memory impairment in the Avoidance test session. However, in the subsequent Stay conditioning, the success rate was not different between ablated fish (abl, black filled circle, N=4) and sham operated fish (sham, white open circle, N=3). Av test abl vs. Av test sham; P*<0.05, two-way ANOVA. (I-K)Two-color conditioning.(I) Behavioral outcomes of all trials for first, last and test session of two-color conditioning. Circles and bars represent the mean +/- SEM, respectively. The Avoidance success rateincreases when the conditioning session advances. The Stay success rate decreases because the fish stop to show the freezing when the conditioning session advances. This overall tendency is not different from Figure 5H which shows behavioral outcomes of the last 10 trials for first, last and test session of two-color conditioning. N=8.
(J) Averaged temporal sequence of fluorescence change in the left optic tectum (blue line, Left tec) and the left telencephalon (pink line, Left tel). The mean +/- SEM is plotted. The cue presentation period was indicated with a red or blue shadowed box depending on the cue color. The large dips of the signals by the blue LED light exposure were artifacts because the blue LED light passed through the green filter (see Full Experimental Procedures). N=3 for each contingency.
(K)Traces of activated area for Avoidance and Stay task memory retrieval. Traces of activated area corresponding to the retrieval of the Avoidance (orange line) and Stay (green line) task memory were drawn in the outlined telencephalic area of each individual. Fish #1-#3 were trained by red LED-Avoidance task/ blue LED-Stay task contingency and fish #4-#6 were trained by blue LED-Avoidance task/ red LED-Stay task contingency. Scale bar indicates 400 μm.
|
