
Fig. 5
- ID
- ZDB-FIG-130619-26
- Publication
- Nair et al., 2013 - The chromosomal passenger protein birc5b organizes microfilaments and germ plasm in the zebrafish embryo
- Other Figures
- All Figure Page
- Back to All Figure Page
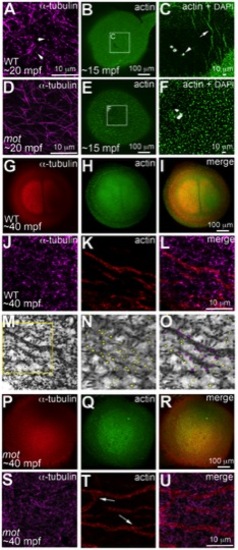
motley/birc5b mutants fail to rearrange cortical actin microfilaments. Animal views of blastodisc cortex. In wild-type embryos (A–C) tips of the sperm monoaster microtubules are found at the cortex (A, arrows). Microtubule punctae are seen at the cortex, which are the ends of astral microtubules present in focal planes beneath the cortex (not shown). Short F-actin seed filaments polymerize (C, arrow) and clear from the center of the wild-type blastodisc (B, C; polar body, arrowhead in C), and congressing pronuclei are also apparent). In motley/birc5b mutants, sperm monoaster microtubules tips cannot be detected at the cortex (D), and polymerizing F-actin seed filaments fail to clear from the center (E, F). At 40 mpf in wild-type embryos, astral microtubules of the first mitotic spindle radiate towards the blastodisc cortical periphery (G) while the microfilaments are seen at the cortical periphery in concentric rings (H, I). The tips of the mitotic aster microtubules are also seen at the cortex at this time, (J) where they contact peripheral microfilaments (K, L). Panel M is a color-inverted black and white image of J, a region of which has been expanded in (N,O). In (N), microtubule tips in J and M are indicated by yellow dots, while in (O) microtubule tips from N that additionally appear in contact with the microfilaments have been colored magenta. Mitotic astral microtubules fail to separate in motley (P) and the microfilaments are found aberrantly in the center of the cortex and are branched (Q, R). The tips of motley mitotic aster microtubules are also absent at the cortex (S), while microfilaments in motley are aberrantly branched (T, U, arrows in T indicate ectopic branching) and do not appear to colocalize with microtubules (U). Panels C and F are high magnifications of indicated boxes in B, E, respectively. Panels A, D, (J–O) and (S–T) are high magnifications of the cortex from blastodiscs of stages comparable to those in B, E, I and R, respectively. Reduced labeling intensity of the right aster in G is an imaging artefact due to slight tilting of the blastodisc within the semi-flat mount preparation. |
| Fish: | |
|---|---|
| Observed In: | |
| Stage: | 1-cell |