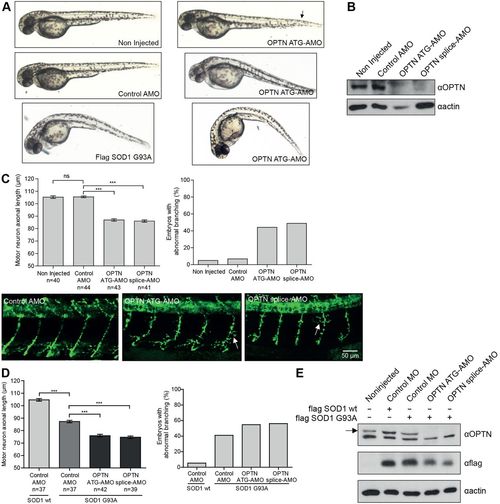
OPTN depletion in zebrafish causes motor axonopathy and increases motor axonopathy induced by mutant SOD1 overexpression. (A) Zebrafish injected with OPTN-specific translation blocking (OPTN ATG-AMO) morpholino showed a phenotype (curved tail indicated by the arrow) similar to that observed in zebrafish overexpressing SOD1 G93A at 48 hours after fertilization in comparison with non-injected zebrafish or zebrafish injected with control morpholino (control AMO). A comparable phenotype was also observed in zebrafish injected with splice blocking (OPTN Splice-AMO) morpholino (data not shown). (B) Immunoblot analysis of protein extracted from zebrafish using antibodies against OPTN and actin showed efficiency of OPTN silencing. (C) Quantification of motor axon length and branching in zebrafish injected with two different OPTN AMO revealed shorter motor neuron axons and increase premature branching in comparison with non-injected zebrafish or zebrafish injected with control AMO. Abnormal branching is expressed as percentage of embryos showing premature branching in two or more axons. Representative images of motor neuron axons at 48hours after fertilization from each group are shown below. Motor neurons are labeled with SV2 antibody. White arrows indicate premature branched axons. (D) Quantification of motor axon length and branching in zebrafish with overexpressed FLAG-SOD1 G93A and control AMO showed a decrease in motor neurons length and increase in premature branching compared with zebrafish overexpressing wild-type FLAG-SOD1 and control AMO. Zebrafish with overexpressed FLAG-SOD1 G93A and OPTN AMO showed an additional decrease in motor neuron length and additional increase in premature branching. (E) Immunoblot analysis of protein extracts from zebrafish with RIPA buffer using antibodies against FLAG, OPTN and actin shows efficiency of OPTN silencing and FLAG-SOD1 expression. All data are shown as mean values±s.e.m.; **P<0.01; ns, not significant.
|
