
Fig. S2
- ID
- ZDB-FIG-130429-3
- Publication
- Liu et al., 2013 - Eaf1 and Eaf2 negatively regulate canonical Wnt/β-catenin signaling
- Other Figures
- All Figure Page
- Back to All Figure Page
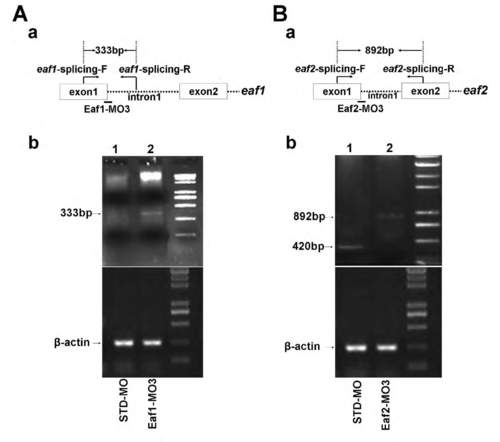
Validation of Eaf1-MO3 and Eaf2-MO3. (A) (a) Schematic of eaf1 exon-intron structure, Eaf1-MO3 targeting position and RT-PCR primer locations. (b) In STD-MO injection embryos, an expected 333 bp band could not be detected by RT-PCR, but in embryos with Eaf1-MO3 injection, a 333 bp band could be detected by RT-PCR. (B) (a) Schematic of eaf2 exon-intron structure, Eaf2-MO3 targeting position and RT-PCR primer locations. (b) A 420 bp band was amplified from embryos injected with STD-MO by RT-PCR, but a 892 bp band was amplified from embryos injected with Eaf2- MO3, which contained intron 1 of eaf2. Embryos were collected at the bud stage for RNA extraction. Lane 1 is RNA from embryos injected with STD-MO, and lane 2 is RNA from embryos injected with Eaf1-MO3 (Ab) or Eaf1-MO3 (Bb). |