
FIGURE
Fig. 4
- ID
- ZDB-FIG-130411-22
- Publication
- Sundström et al., 2013 - Interactions of zebrafish peptide YYb with the neuropeptide Y-family receptors Y4, Y7, Y8a, and Y8b
- Other Figures
- All Figure Page
- Back to All Figure Page
Fig. 4
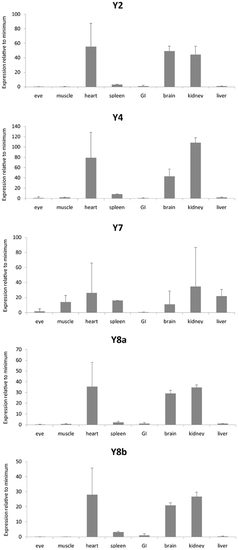
Expression data for neuropeptide Y receptors in a panel of eight zebrafish organs. Error bars display standard error of the mean. Normalized Ct values were used to calculate the relative expression values. For each transcript the tissue with the lowest expression was used to calculate relative expression. For the different genes, the following tissues had lower expression: Y2, eye; Y4, GI; Y7, GI; Y8a, eye; Y8b, muscle. The analysis was performed twice, each time with duplicate samples. |
Expression Data
| Genes: | |
|---|---|
| Fish: | |
| Anatomical Terms: | |
| Stage: | Adult |
Expression Detail
Antibody Labeling
Phenotype Data
Phenotype Detail
Acknowledgments
This image is the copyrighted work of the attributed author or publisher, and
ZFIN has permission only to display this image to its users.
Additional permissions should be obtained from the applicable author or publisher of the image.
Full text @ Front. Neurosci.