|
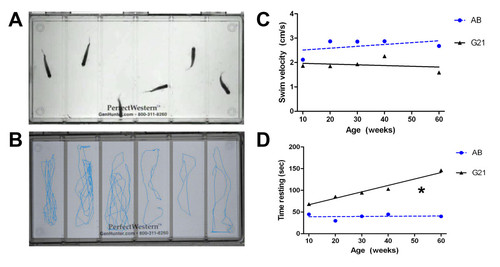
Activity monitoring in transgenic ALS zebrafish. (A): Representative experimental layout for monitoring spontaneous swimming behavior of 20 week old control (wells 1-3) and transgenic G93A-SOD1-GFP (wells 4-6) zebrafish using the Noldus Larvae Activity Monitoring System. (B) Movement tracks extrapolated from a 1 minute trial by EthoVision for analysis of multiple different activity parameters. (C) While minimal differences are observed in the spontaneous activity levels of transgenic and control zebrafish throughout the disease course, transgenic G93A-SOD1-GFP zebrafish exhibit a consistently lower swimming velocity relative to age-matched AB controls. (D) As the disease progresses, transgenic G93A-SOD1-GFP zebrafish spend more time resting than age-matched control AB zebrafish. * P < 0.01 compared to AB control slope.
|